This site uses cookies to improve your experience. To help us insure we adhere to various privacy regulations, please select your country/region of residence. If you do not select a country, we will assume you are from the United States. Select your Cookie Settings or view our Privacy Policy and Terms of Use.
Cookie Settings
Cookies and similar technologies are used on this website for proper function of the website, for tracking performance analytics and for marketing purposes. We and some of our third-party providers may use cookie data for various purposes. Please review the cookie settings below and choose your preference.
Used for the proper function of the website
Used for monitoring website traffic and interactions
Cookie Settings
Cookies and similar technologies are used on this website for proper function of the website, for tracking performance analytics and for marketing purposes. We and some of our third-party providers may use cookie data for various purposes. Please review the cookie settings below and choose your preference.
Strictly Necessary: Used for the proper function of the website
Performance/Analytics: Used for monitoring website traffic and interactions
Heres how to take insights from customer feedback and turn them into results. Build a foundation that drives action Use reportingtools to translate feedback into trends. Turn survey responses, review data, and post-purchase feedback into clear dashboards your teams can actually use. Level it up!
Are you struggling to make sense of scattered user data? The right customer analytics platform helps you uncover exactly how customers interact with your product: so you can spot issues early, optimize user journeys, and drive sustainable growth. Choose the best fit for your needs and transform data into actionable strategies.
Imagine this: Your IT team has invested in cutting-edge observability tools to keep systems running smoothly. While observability is essential for identifying performance bottlenecks and ensuring reliability, unchecked data collection and storage costs can make it a financial burden rather than an enabler.
This guide covers everything you need to know about outsourced software product development services , from core definitions and benefits to a stepbystep process, pros and cons, realworld case studies, and future trends. This lean approach allowed the founding team to validate the market before investing in a full inhouse team.
Security challenges and what to look out for when choosing a session replay tool. Once installed, a session replay tool tracks these DOM modifications and sends the data to its servers for processing and storage. This granular insight makes it easy to understand user needs and enhance their experience.
Data-driven decision-making: Strong analytical skills, with the ability to use data to drive decision-making and measure success. This team works on high-impact projects that aim to amplify our global user base and drive the long-term growth of our products through data analysis, value creation, and experimentation.
LogRocket is a popular debugging tool among developers, thanks to features like session replay and error tracking that make it easy to diagnose technical issues affecting product operations. This way, you no longer have to watch the whole footage to find insights. That includes: Automatic data masking.
The key is making better use of what you already haveintegrating AI into tools like Jira, GitHub, AWS, and Compass to unlock their full potential. Lack of real-time insights: Engineering leaders rely on outdated reports instead of having an up-to-the-minute view of system performance, security risks, and team productivity.
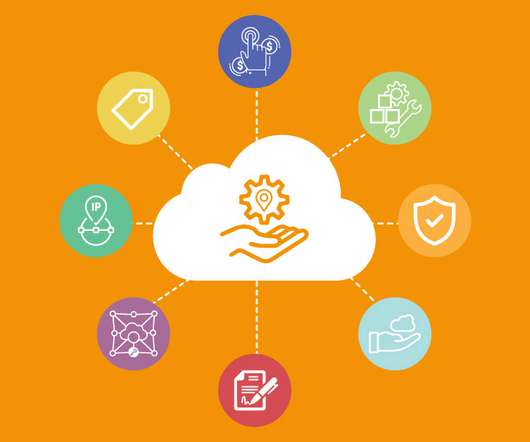
AWS Costs Can Spiral – Tags Offer Granular Insight A well-structured tagging strategy allows businesses to have deeper cost visibility, allocate expenses accurately, and enhance accounting governance. Not all services and resource types currently support tags (see Services that support the Resource Groups Tagging API).
Expanded Scope and Coverage NIS2 broadens the scope of the original NIS Directive (NIS1) by covering a wider range of sectors and entities, including energy, transport, health, digital infrastructure, and other essential services. Incident Reporting One of the most specific and stringent requirements of NIS2 is timely incident reporting.
That’s why 73% of patients wish they could view all their healthcare information in one place, from benefits data, like their remaining deductible, to provider bills and more. But most tools still need some engineering help to build basic communication features, like tooltips, banners, or modals.
At Arkenea, we’ve built our entire service model around transforming these potential obstacles into competitive advantages. Our rigorous vetting process ensures that every professional who joins our team possesses not just technical excellence but also the problem-solving abilities and innovation mindset that US businesses demand.
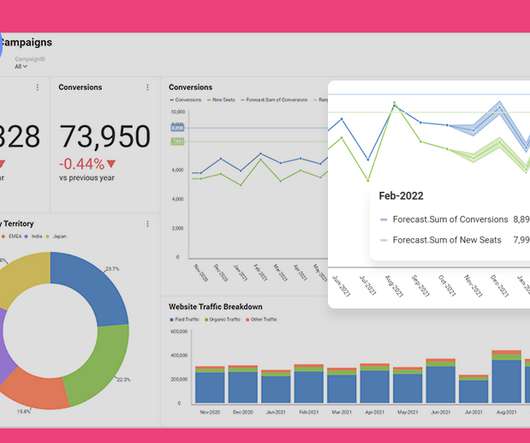
As you’re researching dashboardreportingtools, you’ve probably noticed how hard it is to find reliable information on the available solutions. TL;DR Dashboards display critical business data in real-time, streamlining decision-making and focusing on key metrics. Let’s dive in!
A self-servicedata platform is the backbone of informed decision-making and a growing SaaS business. But how do you choose the right data platform for product analytics ? Let’s go over what a data platform is, its importance, and the must-have features you should consider to choose the right platform for you.
Explore the secrets of creating a successful Crypto Prediction and Opinion Platform, and provide users with insights to help them navigate the cryptocurrency market wisely. Crypto prediction platforms provide valuable insights into the volatile world of cryptocurrency markets, aiding users in making informed decisions.
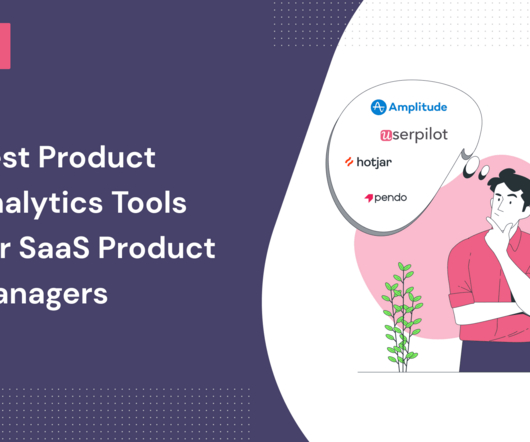
What are the best product analyticstools that PMs can use to gather product insights ? Well, this depends on your product, how established your SaaS business is, and what kind of insights you need. In the blog, we look at 4 well-known product analyticstools, their pros, cons, and most suitable applications.
What analytics features does WalkMe support? You will also discover three alternatives to WalkMe and learn about their analytics capabilities. The WalkMe Insights platform forms the core of WalkMe analytics. The specific analytics features available differ between the customer and employee onboarding solutions.
But given the fact that this industry demands different touchpoints for its clients, it is only appropriate for insurance companies to make their services more accessible and in turn, keep track of their customers via mobile apps. Policy Details The elements of this feature can be guessed from the name itself. trillion USD by 2025.
Reveal Embedded Analytics. Businesses of all industries and all sizes incorporate embedded analytics technologies and capabilities into their own software, SaaS platforms, Angular apps , or other apps because of the tremendous benefits that they get. See Reveal in Action. CRM: Maximize customer lifetime value.
processes, tools, products, and services. Continuous improvement in the software outsourcing services faces challenges to the teams and team leaders and entails risks. Enterprises use continuous improvement in software development or data automation solutions. Read the article to know what it is?
Reveal Embedded Analytics. While businesses continue making analytics and BI their top investment priority, new techniques, and trends emerge, making dataanalytics faster, easier, and even more powerful. . From this article, you’ll learn: What is augmented analytics ? Who is augmented analytics for?
If you want to get the data you need without having to collect it first, Heap tracking features can capture in-app events automatically and make retroactive analysis a breeze. The main analyticstools Heap offers and how to use them effectively. You need to gather qualitative data as well.
Because of how complex product management can be, it’s not hard to see why effective data sharing can be difficult to achieve throughout an entire organization. These obstacles result in data silos that lead to different departments having conflicting data and struggle to access data quickly. What are data silos?
Banking mobile apps, trading platforms, blockchain, contactless payments, NFT, financial data analysis-all these terms fall into the fintech category. CB Insights states that 41 fintech startups that are backed by venture capital are worth $154.1 Chime doesn’t charge anything for service, using ATMs and foreign transactions.
link] covers most of the FAQs about our licensing policy. We can deploy eG Enterprise either way: on-premises or as a SaaS service. More details of our SaaS service for Citrix monitoring are available here. to test the entire service delivery chain. Questions & Answers.
Prefer watching your insights? The data is inconclusive. Are you being data-driven? These statements distill thousands of data points into something much more straightforward and valuable for your leadership team. Dashboards of user behavior summarizing trends. Executives are pushing urgency. it’s not worth it.
Here is our January recap of the latest product releases : Scheduled Reports. Scheduled Reports. You can now schedule reports to arrive directly to your inbox. You can now schedule reports to arrive directly to your inbox. Scheduled Reports are part of our Advanced Reporting Features, available only on paid plans.
Reveal Embedded Analytics. The business intelligence (BI) and dataanalytics world continue to undergo massive transformations every year. Spreadsheets finally yield their buried treasure and evolved into insightfuldatavisualizations and interactive high-impact dashboards. So, what is to come?
There are enough stories of data breaches and cyber attacks to chill even the savviest security engineer to the core. Suddenly, the team got to know SOC 2 Reports all too well and realized just how burdensome and unscalable it could become, especially for high-growth startups. And that’s where people like Adam Markowitz come in.
In 2023, more web-based businesses will be opting to develop mobile apps to build a loyal customer base, uncover more valuable user insights, and facilitate a more seamless user journey. To enhance the visual difference between the interface layers, designers often use the effects of darkening. it’s too complex.
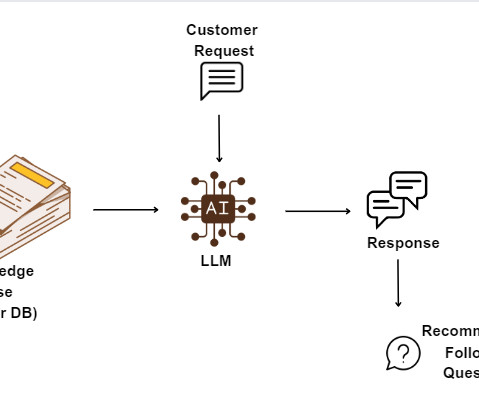
Conversational UI: The Game-Changer in Data Interaction and Application Design We all by nature are social animals and enjoy conversation and interaction. The emergence of conversational UI represents a leap in that direction that will reshape and redefine how we all will interact with data and information in the future.
You will learn what it is, how it differs from a user persona, what data it may contain, and how to create it for your product using a product analyticstool. Thanks to user profiling, you can offer personalized experiences, refine your marketing targeting, and extract data-driven insights to inform product development.
Why does management need to observe data-science-related KPIs? Observability for data-science (DS) is a new and emerging field, which is sometimes mentioned in tandem with MLOps or AIOps. New offerings are being developed by young startups to address the lack of monitoring and alerts for everything data-science.
Reveal Embedded Analytics. Businesses of all industries and all sizes incorporate embedded analytics technologies and capabilities into their own software, SaaS platforms, Angular apps , or other apps because of the tremendous benefits that they get. See Reveal in Action. CRM: Maximize customer lifetime value.
As a SaaS business, we’re regularly trying new products and tools to help us with DevOps. We recently started to evaluate a lot of different SaaS monitoring tools and wanted to share some of our findings. You’ll find some thoughts about the following tools in this post. This is why you want to add it to your web app.
By combining these elements with your product analytics, you can get a complete picture of your most valuable customers. For an even more advanced segmentation, implement an NPS survey and compare that data with your revenue metrics. Segmentation is dividing a market or service based on common characteristics. Source: Canva.com.
There are no firm standards for what makes an application or platform enterprise class, but enterprise-class applications are generally: Open and compatible with existing tools. Secure from inside and outside threats and data leaks. These assumptions dictate how widely the tool can be deployed and what constraints it has during usage.
What that means for us is using and tracking metrics that are going to drive your team to some action, not just creating dashboards or creating reports or red light, yellow light, green light type of information. So what can we do to leverage the data that we can collect to help us actually manage the madness? That’s it.
In today’s digital era, organizations must take a holistic perspective of user experience: Clearly, the availability of an organization’s key IT services and their response times to end-users are key measurements of user experience. The reliability of IT services is another key metric. The many dimensions of user experience.
eG Innovations works with Managed Service Providers (MSPs) across the world, who use eG Enterprise to deliver value-added services to improve their customers’ resilience and business outcomes. Many of these service providers choose eG Enterprise for its secure and granular role-based multi-tenancy support.
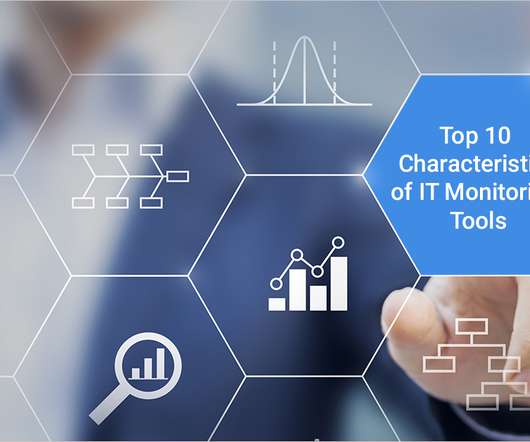
Logging and Auditing in IT Monitoring Tools. In this article, I will help you learn how to discover the auditing capabilities in IT monitoring tools. Role Based Access Control (RBAC) features are a de facto standard for monitoring tools. that may require you to have controls over all the tools you have in place.
Accessing the data stored in eG database using eG CLI. For a number of years, eG Enterprise has also included a richly featured REST API, enabling DevOps and administrators to develop programs and code to automate their monitoring deployments and data retrieval and integrate with other enterprise products. The eG Enterprise REST API.
TL;DR A customer advocate is a professional who represents the customer’s interests within a company, ensuring their needs and feedback are addressed to improve products and services. Use Data to Drive Decisions : Instead of relying on guesswork, leverage customer feedback and product analyticsdata to inform your product strategies.
Many businesses therefore evaluate and use managed IT (Information Technology) services to stay competitive and meet their organization’s technical needs. A managed service provider (MSP) is a business that handles a customer’s IT infrastructure and/or end-user systems remotely, usually on a subscription basis.
We organize all of the trending information in your field so you don't have to. Join 96,000+ users and stay up to date on the latest articles your peers are reading.
You know about us, now we want to get to know you!
Let's personalize your content
Let's get even more personalized
We recognize your account from another site in our network, please click 'Send Email' below to continue with verifying your account and setting a password.


Let's personalize your content