This site uses cookies to improve your experience. To help us insure we adhere to various privacy regulations, please select your country/region of residence. If you do not select a country, we will assume you are from the United States. Select your Cookie Settings or view our Privacy Policy and Terms of Use.
Cookie Settings
Cookies and similar technologies are used on this website for proper function of the website, for tracking performance analytics and for marketing purposes. We and some of our third-party providers may use cookie data for various purposes. Please review the cookie settings below and choose your preference.
Used for the proper function of the website
Used for monitoring website traffic and interactions
Cookie Settings
Cookies and similar technologies are used on this website for proper function of the website, for tracking performance analytics and for marketing purposes. We and some of our third-party providers may use cookie data for various purposes. Please review the cookie settings below and choose your preference.
Strictly Necessary: Used for the proper function of the website
Performance/Analytics: Used for monitoring website traffic and interactions
One practice that both companies established was weekly executive-level metrics reviews. I've come to believe that establishing such a metrics review meeting is critical for developing an effective data-driven culture and I wanted to share some of the best practices around doing so. Why metrics reviews matter.
In this Whatfix Mobile review, youll find answers to three questions: What does Whatfix Mobile offer? Whatfix delivers context-aware guidance that helps users correctly complete sensitive tasks like handling patient documents, uploading payroll data, etc., Whatfix G2 review. Is it the right fit for you? Whatfix mobile pricing.
Reveal Embedded Analytics We know how difficult it is to create dashboards, especially for web applications. Thats what dashboards are for. They track everything from user behavior to system performance. In fact, Angular dashboards can provide key insights that will eventually allow data-driven decision-making at your company.
This fragmentation occurs when critical business information becomes scattered across disconnected systems, creating dangerous blind spots for product managers trying to make informed decisions. Based on your current dashboard, it looks like most users churn before completing onboarding. Sound familiar? Which features need attention?
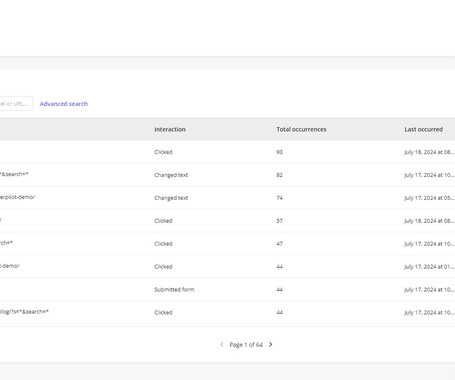
We introduced regular alert review sessions for teams dealing with frequent alerts. Each alert review session starts with an ordered list of alerts that fired in the previous period, ordered by frequency of their firing. fire most frequently) are reviewed first. . 8 questions to ask when assessing your team’s alerts.
But what’s cooler is that you can use these tools to build functional prototypes from a Figma design, convert a rough hand-drawn sketch to a working app, translate a PRD document into an interactive prototype, or even build a usable internal tool for your team, with no coding ability.
It underpins a whole host of core Intercom features – Inbox Views , API , Articles , the user list, Reporting , Resolution Bot , and our internal logging systems. To provide the needed level of this “invisible” management, we utilized a combination of two technologies – Chef and AWS Systems Manager (SSM). Architecture of the system.
For example, here is a video from 2016 that showcases the vision for SpaceX's Interplanetary Transport System which aims to bring the first manned crew to Mars. When you initially document these, they should be pretty light-weight. Execution: Metrics Dashboards. Maybe just a paragraph for each for a total of one or two pages.
Dashboard/Admin Panel This feature is perhaps the most common one as a dashboard or admin panel is present on any type of mobile app and not just on insurance ones. Back in the old days, it was hectic, messy, and tedious because of the lengthy process which required proof submission, paperwork, documentation, etc. Let’s begin.
The research process for even small purchases can be long and difficult: there are reviews to read, content to consume, docs to check, and questions to be asked. ” Since switching to Intercom for live chat support, Disqus can handle 179% more cases than they could with their previous ticketing system.
How to create customer feedback systems to gain insights into user needs ? TL;DR Customer feedback systems are frameworks for collecting, organizing, and analyzing customer feedback for actionable insights. For example, you can improve user experience with in-app guidance , enhance the customer support system, or release new features.
The role of a mobile product manager is still relatively new, and it’s rapidly evolving due to the increased adoption of mobile devices. In traditional product management, the storyboard is an informal document that illustrates the sequence of steps visually. All operating systems support mobile payment systems.
I re-read The First 90 Days , I prepared a learning plan to review with my new boss (the CEO), sketched out some provisional objectives for my first 30/60/90 days, and got some rest to be ready for my new adventure. Review company documents and presentations. We stopped using the system within a month. Do your research.
A global retailer engaged an external partner for endtoend development of a mobile loyalty app, including integration with POS systems, analytics dashboards, and thirdparty loyalty providers. Document nonfunctional requirements such as performance, security, and compliance. Large enterprises may outsource entire product lines.
That’s why the first step in building a marketing tech stack is to monitor and document your marketing processes until you fully uncover the way your teams do things today. Obviously we’re biased (though I would point you to the reviews on G2 Crowd to show that we’re not that biased) but Intercom is the backbone of our entire marketing stack.
However, I can certainly think of product or marketing professionals who use the term value when referring to cheap widgety dashboards and features aimed at novelty seekers, or following an industry trend with no real vision. I interviewed up to ten internal super users who would each review one hundred and twenty SharePoint documents a day.
Analytics dashboards : Find essential adoption metrics, such as the number of active users , user sessions , average session duration, etc., You can also create custom dashboards using metrics of your choice. Userpilot’s analytics dashboards. GA dashboard. Mixpanel’s dashboard. Cohort tables in Userpilot.
Prioritization frameworks Gantt charts/roadmaps Documenting and organizing user research interview results Checklists and task management across teams Spreadsheets do have their drawbacks. Their design system tools remove the need for version control of design files as they’re all in one place. Explore is where it gets fun.
Document360 is a robust platform for creating, managing, and publishing user documentation , ideal for developing comprehensive and user-friendly materials. Your product management tool should be able to connect with other software you use, such as CRM systems, communication tools, or analytics platforms. Creating events in Userpilot.
For example, it is common to hear a bad BPM say they want users to view their dashboard. You are not helping people if someone has to log in every day to check their business accounting system or their personal finances. A Good Behavioral Product Manager Reviews Existing Research. Have you helped them worry less?
When tools and systems are not created with them in mind, they lose trust and understanding. We can create empathetic, intuitive systems When everyone on the team is empowered to understand data, they can make more informed decisions and measure their own success. Strategy 2 — Systems. It doesn’t have to be this way.
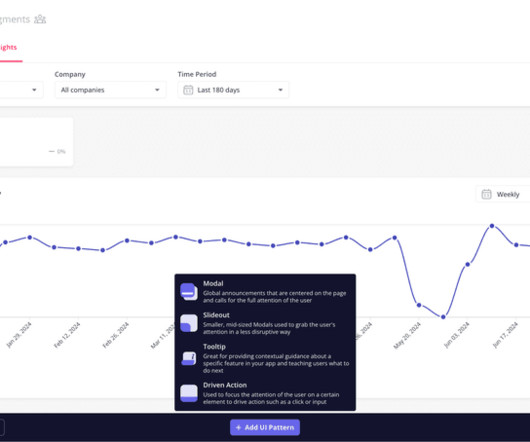
System status visibility. System design matching real-world experience. Help and documentation. System status visibility Offer visibility of what’s happening in the system to spare the user’s frustration. The “saving” call-out is a clear example of system status visibility. Auto personalization.
Content Management System Tools that allow users to create and modify digital content on websites without needing specialized technical knowledge. Track product growth metrics with a custom Userpilot dashboard. Dashboards : Google Analytics boasts several dashboards tracking groups of related events and metrics.
The results reveal that companies integrating UX Research into their growth strategies see significant improvements in conversions, engagement, and retention, with well-documented returns on investment. This fundamental gap in understanding is where UX Research becomes not only valuable but essential for driving authentic and lastinggrowth.
Have built-in and custom analytics dashboards for easy data visualization. User segmentation to review how your different customers behave according to demographics and segments. ClickUp for building automation and reviewing customer data visually. Dashboards for customer data analytics. User segmentation.
You can then track performance using our built-in flow analytics: step completions, drop-off rates, and time to finish, all visible inside the dashboard. Adoption reports, funnels, and trend dashboards, no need for separate advanced analytics tools. Customer support and onboarding documentation also get positive feedback.
Implementing or optimizing systems and processes. Implementing or Optimizing Systems and Processes. Even the best systems and processes need a champion to ensure they run smoothly. A product operations manager can optimize the product team’s systems and processes. Ensuring timely, audience-appropriate communication.
Solution : Zoezi chose Userpilot over other options like Pendo , ProductFruits, and Appcues due to its functionality, cost-effectiveness, and strong customer support. Isa also liked Userpilot’s roadmap and found the support documentation and responsiveness of the customer success team top-notch. Userpilot dashboard builder.
There are three ways in which scripts can be used in eG Enterprise: To add new monitoring capabilities into the system (e.g., To remote control a system, a user session, or application from the web-based console itself (e.g., to take a screenshot of a session, to reboot a system, log off a user, etc.). Yes – we can.
Is the role of product operations about building and documenting processes—guided by the needs and requirements of product? Or is it about refining, documenting, and shepherding the ongoing use of established processes? Other roles exclusively focus on customer data, such as product dashboards and KPI tracking.
There is a reasonable “Getting Started Guide” for the CloudWatch agent and it is worth reviewing the metrics the agent will enable on Windows Server instances and also upon Linux/MacOS instances. For more information about Windows Performance Monitor counters, see the Microsoft Windows Server documentation. Out-of-the-box Dashboard.
This is one of the most popular chatbot and ticketing systems that leverages AI. Technical support Forms of technical support include developers’ docs, one-on-one setup calls, integration assistance, network systems compatibility, tweaks in code, or technical workarounds. Review your analytics after each initiative.
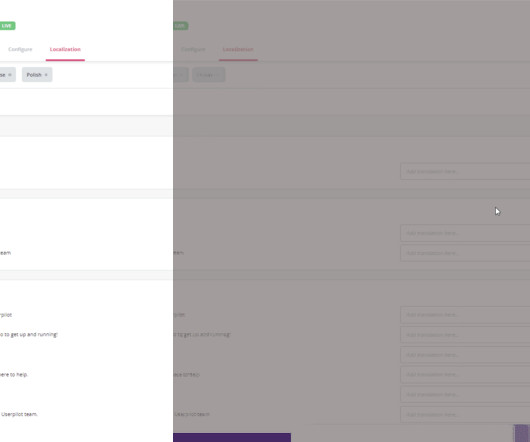
In addition to linguistic and cultural changes, localization often requires changes to the pricing plans , payment systems, functionality, in-app experiences, or software/hardware customization. memeQ is a complete translation management system (TMS) with an asset repository that supports the centralized tracking of translation projects.
By managing systems and processes, product operations ensures timely, audience-appropriate communication. In addition, they own the tools and systems that support the process at every stage. Can we reengineer this system or process for greater efficiency? Systems and processes. Understand. Centralize. Communicate.
They churn, leave negative reviews and bad word-of-mouth. You can track all the key metrics using dashboards like this in Userpilot, so you know when something unusual happens. Do you have systems to track frustration? NPS Survey Dashboard In Userpilot. Frustrated sessions and frustrated users. We all have them.
This article is a review of a newbie platform, Ubercircle. You can schedule content across your social media channels and monitor the performance through the dashboard. Your network of support system?—?A So that was my detailed review of the Ubercircle tool. What’s Ubercircle 2.0?
Documentation helps ensure consistency across teams, facilitates staff onboarding , and helps you improve research processes. Regularly review your processes and share best practices across the organization to improve research quality and integrity. Process documentation is important for 3 reasons. Like Userpilot. Source: PMI.
A couple of months ago, we reviewed the new Firefox browser designed for developers. And all created screenshots and screen recordings are directly stored in your project dashboard, making bug tracking and feedback a lot of fun! The Chrome extension JSONView helps you view JSON documents in the browser. Link: Wappalyzer.
Silos most often occur due to company culture, organizational structures, IT deployments, or mergers and acquisitions. Even organizations with existing systems for managing data could fall victim to data silos if individuals or departments go rogue. Due to the wide variety of software solutions, some data could fall through the cracks.
How I chose the best customer engagement software My evaluation process combined thorough feature analysis , a careful review of user feedback, and insights from industry reports. User analytics: The custom analytics dashboard provides a centralized view of customer data, allowing you to segment, filter, and analyze user behavior.
" "Here is another one-line ticket written by non-technical users who don't understand their problem or our system. We'll " "Field teams engage outside developers (who don't know our systems) to build quick-and-dirty product extensions. " "Engineering has 18 unfilled developer position. ."
TL;DR You should know how to reduce support ticket volume to prevent customers from churning due to a poor support experience. Track whether your support documents are helping customers and refine them accordingly. For example, you may notice a sudden drop in user activity, possibly due to some confusion or frustration.
These one- or two-page documents were once considered the gold standard, offering a quick and straightforward way for employers to assess candidates at a glance. How ATS Systems are Shaping Recruitment ATS systems often scan resumes for exact match keywords and reject documents lacking the required formatting.
Visualizing quantitative data through dashboards : Userpilot offers premade dashboards and the ability to create custom ones, making it easy to visualize quantitative data. These dashboards can be easily shared with stakeholders to keep everyone informed and aligned. Viewing dashboards created in Userpilot.
We organize all of the trending information in your field so you don't have to. Join 96,000+ users and stay up to date on the latest articles your peers are reading.
You know about us, now we want to get to know you!
Let's personalize your content
Let's get even more personalized
We recognize your account from another site in our network, please click 'Send Email' below to continue with verifying your account and setting a password.


Let's personalize your content