This site uses cookies to improve your experience. To help us insure we adhere to various privacy regulations, please select your country/region of residence. If you do not select a country, we will assume you are from the United States. Select your Cookie Settings or view our Privacy Policy and Terms of Use.
Cookie Settings
Cookies and similar technologies are used on this website for proper function of the website, for tracking performance analytics and for marketing purposes. We and some of our third-party providers may use cookie data for various purposes. Please review the cookie settings below and choose your preference.
Used for the proper function of the website
Used for monitoring website traffic and interactions
Cookie Settings
Cookies and similar technologies are used on this website for proper function of the website, for tracking performance analytics and for marketing purposes. We and some of our third-party providers may use cookie data for various purposes. Please review the cookie settings below and choose your preference.
Strictly Necessary: Used for the proper function of the website
Performance/Analytics: Used for monitoring website traffic and interactions
How Rumi Cosmetiques Boosted UserExperience and Conversion Rates in eCommerce: A Case Study for Marketers andManagers Discover how Rumi Cosmetiques achieved a 75% increase in cart adds and doubled conversion rates by enhancing userexperience and conversion rate in eCommerce.
Reveal Embedded Analytics We know how difficult it is to create dashboards, especially for web applications. Thats what dashboards are for. They track everything from user behavior to system performance. Thus, integrating interactive dashboards into web applications is more important than ever. Dont worry.
By understanding how the brains reward system worksparticularly the role of dopamine in shaping behaviorwe can design financial products that provide immediate, positive reinforcement for good moneyhabits. Simple design changes, such as curating product options and reducing clutter, empower users and help them avoid feeling overwhelmed.
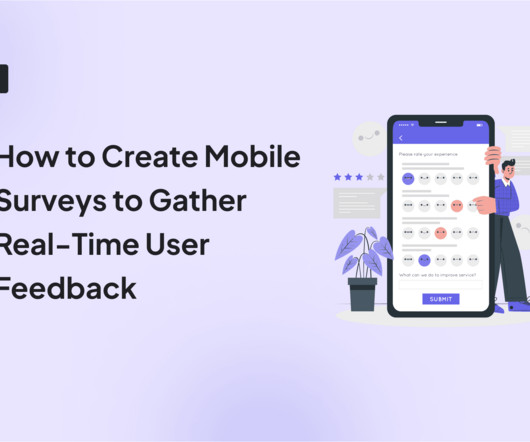
Website feedback and online surveys : These collect opinions about digital experiences, focusing on usability and content quality. Businesses can use this feedback to improve website navigation, enhance userexperience, and drive conversions. Mobile apps also serve as convenient platforms for collecting on-the-go feedback.
But today, dashboards and visualizations have become table stakes. Think your customers will pay more for data visualizations in your application? Five years ago they may have. Discover which features will differentiate your application and maximize the ROI of your embedded analytics. Brought to you by Logi Analytics.
For example, you could: Equip ICU teams with step-by-step walkthroughs so nurses can confidently use life-support dashboards in under ten minutes. Create tailored user journeys based on specific conditions. In-app survey created with Userpilot. Don’t take our word for it.
This fragmentation occurs when critical business information becomes scattered across disconnected systems, creating dangerous blind spots for product managers trying to make informed decisions. Data fragmentation prevents you from delivering the cohesive, personalized experiences your customers expect. Sound familiar?
Problem Brief Over a span of 4 weeks, we tested Civians platform and created design solutions to improve the overall userexperience of the dashboard. We also encouraged them to think out loud while they were navigating the dashboard, to help us uncover their mental model and identify hidden insights.
Alongside usability testing, userexperience interface guidelines allow you to build more intuitive and user-friendly solutions. In this blog, we explain eleven userexperience and interaction design guidelines supported by real-life examples to improve product engagement. System status visibility.
Choose UX research tools with essential features , collaboration, reliable support , user-friendliness, scalability , integrations , and strong security. Userpilot enhances userexperience through in-depth UX research, offering features to gather, analyze, and act on customer feedback.
A product adoption dashboard helps you visualize key adoption metrics so you can make data-driven decisions and boost user engagement. In this article, we cover the following: Why you need a product adoption dashboard. Steps to measure adoption using a comprehensive dashboard. Understand how users adopt new features.
The tool wasn’t too user-friendly and was hard to maintain: The closest thing we had to Userpilot was the help center inside the system, which didn't really work because it was all hard-coded and really horrible to maintain. They had to leave the app and use email, which was inconvenient and led to poor userexperience.
Without a strong and consistent digital brand, financial institutions risk being overshadowed by nimble Fintech startups or tech giants like Apple and Google that excel in userexperience. A strong digital brandensures: Customer Loyalty: A seamless and intuitive digital experience keeps customers engaged. million to 91.7
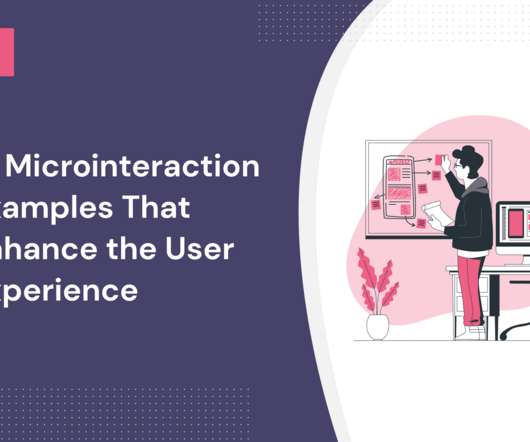
Every userexperience is composed of many microinteraction examples, big and small. In this blog post, we’ll look at some real-world examples of microinteraction use cases and learn how you can implement them into your own designs for better userexperiences. They can be triggered by the user or system.
NPS survey dashboard in UsrGuiding tool. In reality, UX is multidimensional, and it requires multiple qualitative and quantitative metrics like task success rate, user satisfaction score, and summary of user reviews. Such companies rely on user surveys and feedback to evaluate userexperience.
Non-transparent system response Imagine a case: after starting an operation, the system stops responding. However, it doesn’t always mean a frozen system, it may just perform voluminous mathematical calculations, which are so common for fintech apps. Secondly, most fintech apps are to deal with users from across the globe.
A product analytics dashboard helps you visualize user behavior, so you can make informed decisions on how to improve product engagement. In this article, we cover the following: Why you need an analytics dashboard. The types of metrics to track in your dashboard. The most common analytics dashboards in SaaS.
Notification UX is critical for the success of your communication strategy and customer experience. In fact, a bad notification userexperience can ruin the whole product for the user and even cause churn. Let users have more granular control over your app’s notifications. What are notifications?
Up until now, companies have had to choose between two broad schools of support tools: Traditional email-based ticketing systems that prioritize efficiency for the business over the quality of the customer experience. We’ve made it immeasurably better than the experience offered by traditional email-based ticketing systems”.
How to create customer feedback systems to gain insights into user needs ? TL;DR Customer feedback systems are frameworks for collecting, organizing, and analyzing customer feedback for actionable insights. Before you act on user feedback and requests, prioritize them with an appropriate framework. Let’s dive in!
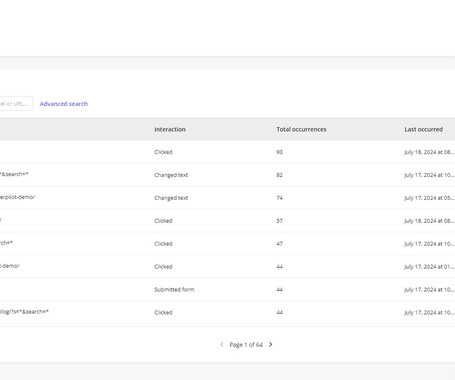
Userexperience can make or break a web app. If your software is slow or buggy, users wont stick around for long. If youre only finding out about these issues after users complain, youre already too late. Autocapture events dashboard in Userpilot. Build and view custom dashboards in Userpilot.
Reveal Embedded Analytics Today’s business users expect more than static dashboards or delayed reports. That is the promise of self-service BI: giving users direct access to the answers they need without relying on data teams or filing support tickets. Self-service capabilities are what make that experience scalable.
Much of the literature that defines the role as the intersection of business, technology, and userexperience isn't particularly helpful for practitioners who are left wondering what skills they need to learn versus the fine people they work closely with in actual business, technology, and userexperience roles.
Mobile app tracking captures data on how users interact with your app, including actions such as screen views, button taps, session length, and feature usage. For example, say a user opens your app, skips the onboarding tutorial , and heads straight to the dashboard. Only to lose interest and leave without using any key feature.
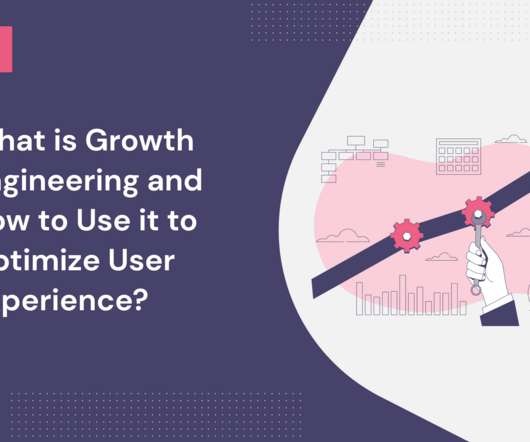
This data makes it easier to optimize product features and improve them to better the userexperience. Ultimately, growth engineering enables SaaS companies to iterate quickly, experiment with possible new solutions, and implement major or minor userexperience improvements. Growth hacking vs. growth engineering.
Developers can remove the pains associated with constantly incorporating new SDKs into an app and focus on delivering products that transform the customer experience. It provides the speed and efficiency mobile apps require for constantly changing products while maintaining the security and integrity of existing systems.
Conversely, if the userexperience heavily relies on a graphic user interface, the larger the gap for the product designer toaddress. However, the actual root lies in the classic debate between analytical thinking (breaking things apart) and systems thinking (focusing on interconnectedness).
Companies already using Whatfix for web For teams already leveraging Whatfix on desktop, extending that functionality to mobile ensures a consistent userexperience across platforms. With a shared dashboard and content strategy, you can manage flows, tooltips, and updates without duplicating effort.
They track 47 different key performance indicators (KPIs) in their mobile analytics platform , spend hours debating dashboard numbers, yet can’t predict which users will churn next week The problem here isn’t a lack of data. Ask targeted questions about specific experiences right when they happen.
Usability testing: Observe users as they interact with your product to identify usability issues and collect feedback on userexperience. E.g., Identify navigation issues in your analytics dashboard based on real-time user interactions. Survey results dashboard in SurveyMonkey. Dashboard example in Hotjar.
Developers can remove the pains associated with constantly incorporating new SDKs into an app and focus on delivering products that transform the customer experience. It provides the speed and efficiency mobile apps require for constantly changing products while maintaining the security and integrity of existing systems.
Embedded analytics solves these pain points by providing insights directly within your application, allowing sales teams to track performance metrics in their CRM and operations teams to monitor workflows through embedded dashboards. Visualization: Presenting data through intuitive charts, dashboards, or reports.
Over time, it has evolved from a simple set of metrics into a comprehensive system for understanding user behavior at each stage of the product journey PostHog,2023. The Emergence of Research-Driven Growth Authentic growth lies not only in analyzing quantitative data but in deeply understanding user behavior and motivations.
Its about building a repeatable system that drives discovery, boosts engagement, and keeps users coming back. In this article, Ill tell you how to: Increase user acquisition with ASO and referral programs. Boost user engagement by improving onboarding with personalization and gamification. Custom design templates.
Well, you hit two birds with one stone, significantly enhancing both the userexperience and the overall effectiveness of the learningprocess. Here are some key advantages: Improved user engagement: A well-designed application captures users attention and keeps them engaged.
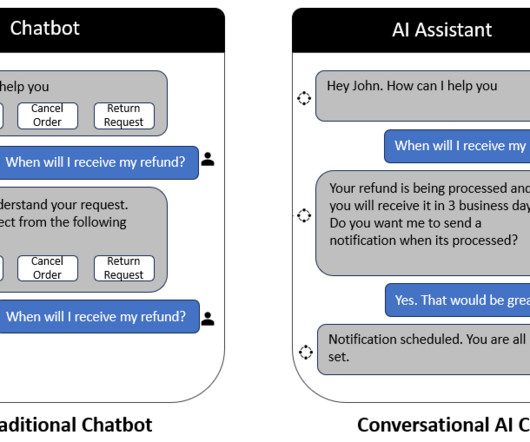
Banking on Conversation: The Future of UserExperience with Conversational UI Image created by the author using Bluewillow AI How many times do we all log in to our banking app and struggle to find information? Conversely, Conversational AI bots possess context awareness and are trained to comprehend user intent.
Whereas conventional websites may focus on visual aesthetics, SaaS is built around productivity and solving user problems. Userexperience becomes the key driver. Rule #1: Build minimalistic interfaces so that users can focus on tasks rather than learning thesystem. RamosUX/UI design of the digital analytics platform 7.
We’ve held close to 100 webinars with Zoom and the userexperience for the business (it hooks into your CRM very nicely) and for participants (the video quality is unparalleled) is next level. Bonus: You can now enable visitors and users to register for webinars directly in the Intercom Messenger with our Zoom integration.
Even if you streamline your onboarding process , you also need to convince your users to trust your app with their sensitive information, especially if you’re a relatively new player in the fintech space and haven’t been able to build an established reputation. Here are some examples we’ve come across of great onboarding experiences.
TL;DR Product analytics tools analyze user interaction, preferences, and engagement with a product. They provide insights to improve userexperience and meet customer needs. They offer data visualization, analyze user behavior data, and identify friction points to improve customer experience.
Launch surveys on specific app screens within the mobile app to assess each user’s journey. Segment and target the right mobile users based on traits, device type, and operating system. Avoid launching surveys in the middle of critical tasks or at times when the user is likely to be busy.
Content Management System Tools that allow users to create and modify digital content on websites without needing specialized technical knowledge. Track product growth metrics with a custom Userpilot dashboard. Session recordings : Hotjar’s session recordings enable you to see how your users moved through your website.
Userpilot helps you with product-led growth by providing actionable insights and personalized userexperiences. Try Userpilot and Take Your UserExperience to the Next Level Get a Demo 14 Day Trial No Credit Card Required What is PLM software? You can use this data to improve product quality and experience.
UXtweak is the best free userexperience research platform. Userpilot is the product growth platform for user journey analytics. Integrations refer to the free exchange of information between applications inside a system. UXtweak helps enhance impact by testing how users interact with your webpage in 5 seconds.
We organize all of the trending information in your field so you don't have to. Join 96,000+ users and stay up to date on the latest articles your peers are reading.
You know about us, now we want to get to know you!
Let's personalize your content
Let's get even more personalized
We recognize your account from another site in our network, please click 'Send Email' below to continue with verifying your account and setting a password.


Let's personalize your content