This site uses cookies to improve your experience. To help us insure we adhere to various privacy regulations, please select your country/region of residence. If you do not select a country, we will assume you are from the United States. Select your Cookie Settings or view our Privacy Policy and Terms of Use.
Cookie Settings
Cookies and similar technologies are used on this website for proper function of the website, for tracking performance analytics and for marketing purposes. We and some of our third-party providers may use cookie data for various purposes. Please review the cookie settings below and choose your preference.
Used for the proper function of the website
Used for monitoring website traffic and interactions
Cookie Settings
Cookies and similar technologies are used on this website for proper function of the website, for tracking performance analytics and for marketing purposes. We and some of our third-party providers may use cookie data for various purposes. Please review the cookie settings below and choose your preference.
Strictly Necessary: Used for the proper function of the website
Performance/Analytics: Used for monitoring website traffic and interactions
Without effective UX analytics that goes beyond collecting data, you’re losing valuable customers. Unfortunately, the research backs this up, with a staggering 90% of users reporting that they stopped using an app due to poor performance. It covers key topics, such as: Defining UX analytics. What is UX analytics?
Think of Net Promoter Score (NPS) software as a tool to measure your customers’ feelings about your product, and categorize them based on their level of loyalty (promoters, neutrals, and detractors). The great advantage of these tools is that they streamline the creation, distribution, and analysis of NPS surveys.
While “use data to drive decision-making” sounds obvious, there’s a HUGE gap between saying it and doing it well. So, how do you get started with product analytics ? In this article, we’ll talk about: What product analytics is and why you need a solid strategy. What is product analytics?
You can gather all the user feedback or behavioral data you want or even generate tons of Google Analyticsreports. Despite all these efforts, you’re probably still not acting on product analytics correctly. Why actionable product analytics are important. This causes siloed data and integration issues.
Most product teams get mobile app analytics wrong. They track 47 different key performance indicators (KPIs) in their mobile analytics platform , spend hours debating dashboard numbers, yet can’t predict which users will churn next week The problem here isn’t a lack of data.
Let’s review everything your customer success team has to do in the absence of any customer success tools. Collect customer data to calculate complex formulas for tracking metrics, monitor customer health scores, and resolve support tickets while continuously trying to improve retention and expansion.
When your company adopts multiple SaaS solutions to drive productivity, you unknowingly create a perfect storm for data fragmentation. Your customer information lives in Salesforce, while your support tickets are in Zendesk, your product usage data in Mixpanel, and your marketing campaigns in HubSpot. Sound familiar?
What is an interactive product demo? An interactive demo is a self-guided walkthrough that uses tooltips, modals, hotspots, and other interactive elements to help users quickly explore your SaaS product. Why build interactive demos for your SaaS product? Define your goals : What do you want to achieve with this demo?
You know your product collects tons of data. Datavisualizationtools help turn your messy spreadsheets into clear, interactive insights. The best ones dont even need SQL or data science skills. Because product analytics should be easy and accessible for everyone, not just data experts.
Reveal Embedded Analytics For product owners, leveraging data is not just an advantageits a necessity. Product analytics empowers you to understand gaps in your offering and how users engage with your product. Both embedded analytics and product analytics are designed to help product owners in diverse ways.
When you’re building a mobile product , data is your lifeline. Whether for tracking feature adoption or spotting drop-off points, the right analyticstool can make or break your growth. Some tools are great for marketers, and others are for product or development teams.
You see, although we work hard to make Userpilot the best product adoption tool on the market, we know it isnt the perfect fit for every business. Robust resource center functionalities for offering self-service help. Custom dashboards to track key metrics at a glance. for collecting user sentiment data.
Drawing from his 20+ years of technology experience and extensive research, Nishant shared insights about how these activities vary across different organizational contexts – from startups to enterprises, B2B to B2C, and Agile to Waterfall environments.
It’s what you do with the behavior data your app collects. And by behavior data, I dont mean installs (thats the easy part). Mobile app tracking captures data on how users interact with your app, including actions such as screen views, button taps, session length, and feature usage. What is mobile app tracking?
A customer expansion strategy is a playbook for increasing the revenue from your existing customers, for example, by selling them additional products and services or encouraging them to upgrade to higher plans. As your team grows and you hire new people or other departments adopt the tool, the number of seats needed increases.
Reveal Embedded Analytics We know how difficult it is to create dashboards, especially for web applications. However, running business operations or targeted campaigns without insights into their effectiveness is not an option. Thats what dashboards are for. It offers several options when it comes to dashboard libraries.
Its a tool. And tools only work when you know what youre building. Cosmetic, without impact: Many startups are investing in shiny, AI-powered features that look impressive in demos but dont deliver realvalue. Some examples: Optimizing operations: AI can streamline workflows, predict bottlenecks, and cut inefficiencies.
Reveal Embedded AnalyticsData-driven companies have a hidden advantage! Theyve consistently outperformed their counterparts, reporting significantly higher metrics across operational efficiency (81% vs. 58%) , revenue growth (77% vs. 61%), and employee satisfaction (68% vs. 39%). How is this possible?
I’m going to take a wild guess and assume that you already understand the importance of mobile in-app feedback tools. You also might be reading this post thinking: “Who’s adding new tools to their tech stack right now?” Do you have the right tools to capture that voice? Mobile in-app feedback tools & solutions.
Tracking user behavior analytics in mobile apps is a whole different challenge compared to the web. Without a global DOM or easy auto-capture tools, tracking mobile app user behavior takes more planning. And the behavioral data you do collect depends on what you choose to track and how you track it. Mobile analytics ?
The choice is tough because there’s no single tool that covers all use cases. What’s worse, you will find multiple tools in each category, making it incredibly difficult to pick the tool that satisfies your needs and offers the best value for money. Which product feedback software should you choose for your SaaS?
However, without qualitative feedback and behavioral insights, teams risk misreading signals, leading to frustration and churn. User feedback is valuable , but without data, its just opinions. To eliminate these blind spots, you need to combine quantitative, qualitative, and visualdata. How to collect each data type.
Are you struggling to make sense of scattered user data? The right customer analytics platform helps you uncover exactly how customers interact with your product: so you can spot issues early, optimize user journeys, and drive sustainable growth. Choose the best fit for your needs and transform data into actionable strategies.
In 2006, British mathematician Clive Humby made the infamous statement: Data is the new oil. Like oil, raw data needs to be refined, processed and turned into something useful because its value lies in its potential. Unfortunately, most people have yet to understand what it truly means to use data. moment that makes users stick.
Nearly 60% of mobile teams still rely on self-hosted push tools. They trade short-term savings for long-term pain: no analytics, poor timing control, and zero personalization. If you want to build a push strategy that improves over time, you need proper analytics, A/B testing , and behavioral insights from day one.
Think about all the insights you could gather to improve the user experience. By showing how users interact with different elements on the page or product screen, session replays provide product teams , designers, and marketers with valuable insights into user behavior. Every click, scroll, hover, or keystroke?
That said, it’s still a pretty powerful feature for web teams who want to find qualitative insights with quantitative data. Plus, before you ask, Mixpanel does include customer data masking by default to keep sensitive user info hidden (it’s always a win to stay GDPR-compliant). Automatic bug reporting (which Mixpanel lacks).
Quantitative data alone doesn’t reveal intent, only outcomes. By combining contextual insights from session replays , heatmaps, and behavior analytics, user session analysis helps you interpret metrics through the lens of real user journeys. Tools can track every click and interaction.
Level Up Your User Onboarding Strategies with Userpilot Get a Demo 14 Day Trial No Credit Card Required 4. Other gamification elements include: Rewards Badges Creativity tools Pressure Progress bars Challenges Explore more gamification examples. Frequency of reported issue. No guesswork, just data. The result?
What happens when you build a product or service around what you think potential customers want, only for them to buy something else? It could include conducting user interviews and surveys, analyzing product usage data, and tracking customer feedback , to name a few. For starters, it shows you dont know your customers well enough.
Thats where real user monitoring tools come inthey provide real-time insights into how users engage with the app , helping you detect performance issues before they impact your bottom line. Third-party integration: Supports integration with analytics, and DevOps tools like Google Analytics, Mixpanel, Splunk, or Datadog.
Unlike traditional mobile web tools, Whatfix focuses exclusively on native mobile environments, allowing enterprises to create deeply integrated, in-app experiences that streamline user onboarding , feature adoption, and contextual in-app training. However, advanced behavior targeting requires a separate analytics integration.
Considering the Amplitude session replay feature and wondering if it’s the right tool for your business? We also reveal an alternative tool with even more expansive features and excellent value for money. Raw replay data is stored for 30 days by default but can be extended to 12 months by purchasing extra retention time.
NPS rarely helps predict trends, churn, or future sales without a correlation. Whereas, if I ask you what you did last Saturday, then the question becomes less subjective and more like a report. You dont need a data engineering team to send NPS surveys and calculate them. At Userpilot, we mostly use NPS for qualitative insights.
With Userpilots mobile solution , you can personalize in-app flows, trigger context-aware push notifications, and capture real-time insights: all without writing a single line of code. Userpilot is a no-code digital adoption platform that unifies mobile and web engagement, analytics, and feedback. But it doesnt have to be that way.
A great product tour example of how to do this right is Attention Insight. Interactive tooltip onboarding built with Userpilot for Attention Insight. +47% 47% User Activation Rate with Userpilot: Attention Insight Case Study Attention Insight improved their new user activation rates by over 47% with Userpilot’s onboarding flows.
In today’s competitive landscape, customer experience (CX) stands as a cornerstone of success, particularly in the financial services industry. Whether through surveys, online reviews, or direct interactions, gathering actionable feedback provides invaluable insights into areas for improvement.
Looking for a Google Analytics alternative that offers better customization, improved product analytics , and more data accuracy? TL;DR Google Analytics is an analytics platform offered by Google that helps businesses track website or app performance. Limited data control and ownership.
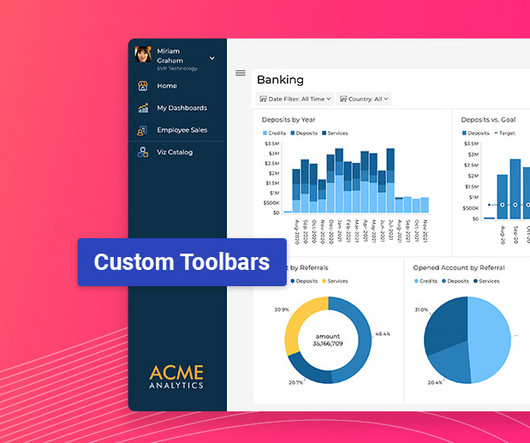
Reveal Embedded Analytics Explore how these game-changing features can accelerate your products growth. Latest Update Features: Custom Toolbars: Full control over dashboard menus. Interactive Filtering: Compare data instantly. Axis Title Control: Sharpen data clarity. visualization title).
Does the thought of quantitative data analysis bring back the horrors of math classes? But conducting quantitative data analysis doesn’t have to be hard with the right tools. Want to learn how to turn raw numbers into actionable insights on how to improve your product? Collecting and cleaning data.
If youve ever tried evaluating product tour tools, you know the surface-level comparisons dont tell you much. Every tool claims to be a no-code tool and easy to use, but few support the workflows product teams care about, like multi-step onboarding , flow targeting, mobile support, or analytics that go beyond step views.
SaaS tools are the industry's biggest open secret. Wondering what type of tools you should have in your stack? TL;DR SaaS tools are applications that users can access through an internet connection. There are different types of SaaS tools for different purposes. ProductPlan is the best tool for road mapping.
The COVID-19 pandemic has more and more people using app-based food delivery services, and QSRs are seeing an influx of mobile payments at their drive-throughs with the closure of dine-in establishments. When you have solid benchmarks to measure against, they can help you make sense of your own data and answer these questions.
Reveal Embedded Analytics This update is packed with customization, usability, and performance improvements to help you build seamless, high-impact analytics experiences faster. Fixed Lines for Charts: Set static reference points to highlight key data trends. Build on-brand, scalable analytics today.
We organize all of the trending information in your field so you don't have to. Join 96,000+ users and stay up to date on the latest articles your peers are reading.
You know about us, now we want to get to know you!
Let's personalize your content
Let's get even more personalized
We recognize your account from another site in our network, please click 'Send Email' below to continue with verifying your account and setting a password.


Let's personalize your content