This site uses cookies to improve your experience. To help us insure we adhere to various privacy regulations, please select your country/region of residence. If you do not select a country, we will assume you are from the United States. Select your Cookie Settings or view our Privacy Policy and Terms of Use.
Cookie Settings
Cookies and similar technologies are used on this website for proper function of the website, for tracking performance analytics and for marketing purposes. We and some of our third-party providers may use cookie data for various purposes. Please review the cookie settings below and choose your preference.
Used for the proper function of the website
Used for monitoring website traffic and interactions
Cookie Settings
Cookies and similar technologies are used on this website for proper function of the website, for tracking performance analytics and for marketing purposes. We and some of our third-party providers may use cookie data for various purposes. Please review the cookie settings below and choose your preference.
Strictly Necessary: Used for the proper function of the website
Performance/Analytics: Used for monitoring website traffic and interactions
Reveal Embedded Analytics Today’s business users expect more than static dashboards or delayed reports. They want to explore live data, uncover insights, and take action in real time. Traditional BItools were not built for embedded use cases. This is where embedded self-serviceBI comes in.
Reveal Embedded Analytics Your engineering team is shipping fast. But your enterprise BI setup? It’s often still stuck in a silo, delivered through disconnected tools, legacy portals, or time-consuming handoffs. Most enterprise businessintelligence platforms were never designed for in-app use.
Reveal Embedded Analytics We know how difficult it is to create dashboards, especially for web applications. However, running business operations or targeted campaigns without insights into their effectiveness is not an option. Thats what dashboards are for. What is an Angular Dashboard Library? Dont worry.
Reveal Embedded AnalyticsData-driven companies have a hidden advantage! Theyve consistently outperformed their counterparts, reporting significantly higher metrics across operational efficiency (81% vs. 58%) , revenue growth (77% vs. 61%), and employee satisfaction (68% vs. 39%). How is this possible?
Think your customers will pay more for datavisualizations in your application? But today, dashboards and visualizations have become table stakes. Discover which features will differentiate your application and maximize the ROI of your embedded analytics. Brought to you by Logi Analytics.
Five years ago, including embedded analytics in an application was a powerful way for product teams to differentiate their applications, reduce customer churn, and charge more for their products. When considering the value of analytics relative to their products overall, survey respondents estimated the value at 54%, up from 45% in 2016.
Starting a career as a businessintelligence analyst requires understanding the key steps, skills, and experiences needed for success. In this article, we will outline the typical journey for businessintelligence analysts, covering educational requirements, entry-level positions, potential advancements, and long-term opportunities.
Reveal Embedded Analytics Introduction to Embedded Analytics in Angular and.NET Core Embedded analytics is no longer an optional featureits a necessity for modern applications. In 2025, users demand seamless access to real-time insights directly within the tools they use daily. Why is Embedded Analytics Essential?
Every company, of every size — even organizations of just one person — are navigating a data avalanche problem. Every team — from product to marketing, and IT to engineering — is generating data. A strong analytics stack is foundational to being able to make sense of it all. Data Tracking and Collection. Event Data.
Visualdata surrounds us – colorful charts on weather reports, infographics on the web and in social media articles, map charts in presentations, etc. To help you get started with datavisualization, this article explores various visualization methods and their use cases. Funnel charts. Pie charts.
Reveal Embedded Analytics. Embedded analytics is everywhere around us – in our cars, in our homes, in our security systems, in the digital advertising that we see while surfing the web, and even in the healthcare services we are being treated with. And that is because data nowadays is everything. Especially in business.
By analyzing user behavior patterns and uncovering valuable insights, behavior analyticstools enable businesses to design strategies that drive retention and business growth. Discover the cutting-edge of behavioral analyticstools! There are different types of behavioral analyticstools used in SaaS.
I did classic web development before there were frameworks back in the ’90s. This definition is a mouthful, so I like to visualize it. I’m going to walk through this visual quickly, and then Cecilie and I are going to dive into this in more depth. A core part of this is this visual.
The payoff is already visible in richer digital experiences, sharper personalization and faster, safer service. Within this article, we analyze how AI’s adoption in 2024 impacted key areas of digital CX, highlighting global trends as well as specific insights from major markets like the US and UK.
Google Analytics as Your Default Platform? As a product manager, the impact of your business decisions will be measured by your product’s front-end data. It is your obligation to be able to implement an analytic platform, analyze the data and present your findings. Visualization. In-app Services.
Look for unique applications of the tools you already have. This approach can reveal unexpected insights and user preferences, helping you shape the final product. Listen now on Apple , Spotify , and YouTube. Raiza previously worked on AI Test Kitchen and has a background in startups, payments, and ads.
In fact, the 2024 Buyer Experience Report by 6sense found that a whopping 85% of buyers establish purchase requirements before even contacting sales. Step 2: Collect internal assets Once you’ve decided on your use case, it’s time to dig into your internal assets to gather crucial customer data. moments along your customer journey.
Reveal Embedded Analytics. It’s hard to believe that many organizations in today’s data-driven world are still struggling to make use of the vast amounts of data they possess and that for most, accessing and analyzing data remains a distant goal. The Do’s of Embedding Analytics Into Your Apps.
What is DataVisualization? More than just making numbers look pretty, datavisualization is the graphical representation of information. Graphs, charts, maps, and tables are powerful communication tools, helping to make data more accessible. Why is DataVisualization important for Product Managers?
With Userpilots mobile solution , you can personalize in-app flows, trigger context-aware push notifications, and capture real-time insights: all without writing a single line of code. Userpilot is a no-code digital adoption platform that unifies mobile and web engagement, analytics, and feedback. But it doesnt have to be that way.
Reveal Embedded Analytics. Businesses of all industries and all sizes incorporate embedded analytics technologies and capabilities into their own software, SaaS platforms, Angular apps , or other apps because of the tremendous benefits that they get. Crypto: Leverage the most suitable market conditions and invest intelligently.
How New Heuristics Are Reshaping the Creative Process Between Humans andMachines Image generated byChatGPT When the wave of generative AI tools began flooding the market, I must confess my reaction was mixed: a sense of fascination for the possibilities and concern for the ethical challenges looming on the horizon.
Reveal Embedded Analytics With abundant data, users have shifted to a data-first approach to guide their decision-making process. Integrating powerful BI with fully interactive visuals and reports into your Blazor applications makes dataanalytics accessible to all your end-users.
No product tool or template can save you if you’re not killing it in these three areas. That’s why we’ve listed 12 tools that the best product managers use to do their jobs better? That’s why we’ve listed 12 tools that the best product managers use to do their jobs better?—?and and not the best product management tools.
Let’s take a look at how connecting user onboarding tools to Intercom can power up your onboarding flow, plus get the details on our favorite integrations for extra features like videos, surveys, analytics and support. How to choose the onboarding tools you need (and avoid tool overload).
While the product adoption platform offers decent user onboarding and engagement features, it lacks advanced analytics capabilities and is quite expensive. With it, you can easily connect your knowledge base, developer documentation, and other resources to a search bar within your product. The best part? Modals in Chameleon.
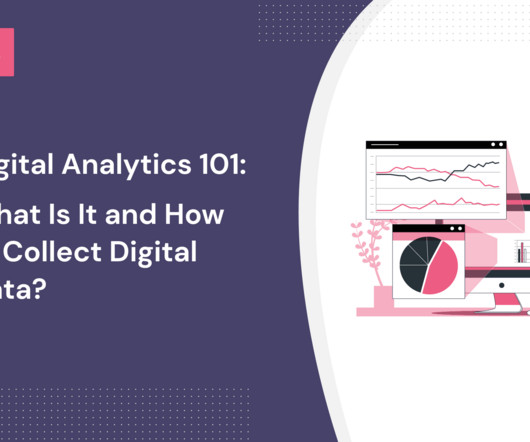
What’s digital analytics? How can it help product and marketing teams make data-driven decisions and improve the user experience at different stages of the customer journey? TL;DR Digital analytics allows teams to measure and analyze product performance to improve their digital strategy. This could be website data (e.g.,
Surveys are one of the most effective tools for collecting structured and unstructured feedback—and the right survey software makes it easier than ever to do so at scale. In this quick guide, we’ll tackle the most frequently asked questions about surveys and survey tools, so that you can turn feedback into action with confidence.
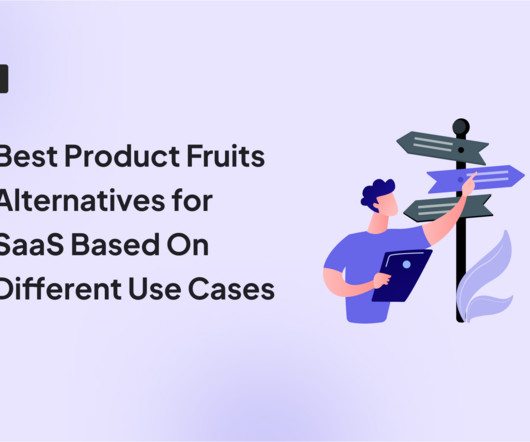
Looking for a good user onboarding tool and wondering if Product Fruits is the best option for your SaaS company? Product Fruits is one of the most affordable user onboarding tools on the market, making it ideal for small startups with a budget under $200. Product Fruits for user analytics Product Fruits has minimal analytics features.
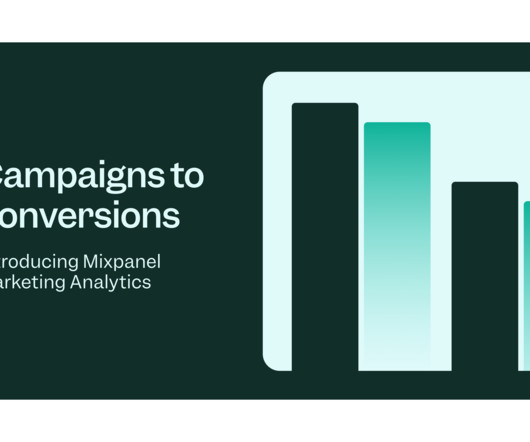
Mixpanel launched over a decade ago as an analyticstool for product teams. That makes it important to use the same analyticstool. Traditional marketing analyticstools were built for just the web, but marketing channels have evolved. There are two reasons why.
As a fellow PMM who’s been there, I can tell you that traditional analyticstools just don’t cut it anymore. That’s where Userpilot’s mobile analytics come in. It’s built for product people who need clear insights without drowning in data. Why choose Userpilot for mobile analytics?
Embarking on a career as a businessintelligence analyst involves a combination of education, skills development, and practical experience. This guide will provide you with a comprehensive overview of the path to becoming a successful businessintelligence analyst. Let’s dive in!
Whether you’re looking to deepen your expertise, stay updated with industry trends, or find practical tools to enhance your workflow, the right resources are essential for continuous growth and success. Looking to leverage product data for insights? Consider Userpilot for its engagement features and analytics capabilities.
Embed a video in modals with Userpilot. Embed tutorial videos in your resource center for self-serve support Integrate videos to an in-app hub so that users can find answers when they need them. For example, Userpilot’s resource center enables you to embed videos that provide visualized assistance.
Key Tasks User issues reports. Identify key quality metrics and create dashboards to track real-time product health. Bug Service Level Agreement (SLA). Identify measures of success, create dashboards for tracking, and report on progress to ensure team’s know whether or not they’re hitting the mark. Bug triage.
We know it can be daunting to pick just one tool, that’s why we’ve created this listicle and compared 10 top tools and their features side by side, helping you make a faster decision. TL;DR Customer success software refers to tools that help manage customer experiences and drive customers toward their desired outcomes.
If youve ever tried evaluating product tour tools, you know the surface-level comparisons dont tell you much. Every tool claims to be a no-code tool and easy to use, but few support the workflows product teams care about, like multi-step onboarding , flow targeting, mobile support, or analytics that go beyond step views.
According to Userpilot’s SaaS Product Success Metrics Benchmark report , Fintech and Insurance companies had the second-lowest activation and adoption rates of all industries. This is because the client onboarding process in financial services faces unique challenges. What are they? Let’s get started.
Todays Fintech disruptors and neobanks are igniting our brains reward centers with flashy visuals, gamified challenges and social interactivity that practically beg us to keep coming back for more. It ultimately changes how we think about financial services. Today, clients expect more than a basic straightforward financial service.
It helps teams uncover real user needs, validate assumptions, and reduce development risks before committing time and resources. Yet, many teams rush into development without properly testing ideas, leading to wasted effort and failed launches. Testing Assumptions Before Development 3.
Let’s face it: qualitative data analysis is vital to understanding why users act in a particular way and how they feel about your product in a way that quantitative product analytics can’t. This article will teach you how to analyze qualitative data to inform product development and improve the product experience.
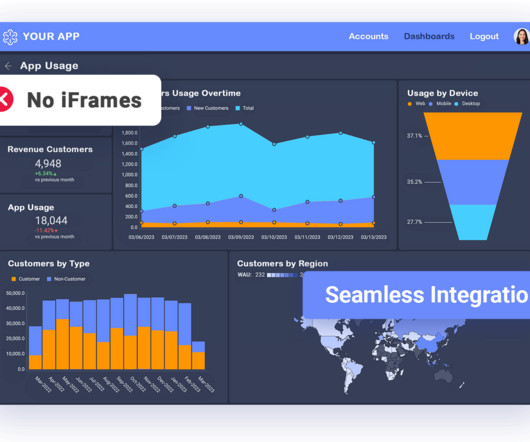
Reveal Embedded Analytics Integration is the most important thing to consider when choosing an embedded analytics vendor to partner with. When analytics into an existing application, the user experience, workflows, and branding must flow seamlessly without adding complexity or confusion to your customers.
Below, we'll show you how to write the perfect data analyst resume. Highlight the most relevant projects that align with the goals of the data analyst role you're applying for. Highlight the most relevant projects that align with the goals of the data analyst role you're applying for.
Reveal Embedded Analytics Reveal is an industry-leading embedded analytics solution that aims to provide ease of use for integrating powerful analytics capabilities into applications. Making Reveal accessible to all types of business users, regardless of their experience and expertise, has always been our priority.
We organize all of the trending information in your field so you don't have to. Join 96,000+ users and stay up to date on the latest articles your peers are reading.
You know about us, now we want to get to know you!
Let's personalize your content
Let's get even more personalized
We recognize your account from another site in our network, please click 'Send Email' below to continue with verifying your account and setting a password.


Let's personalize your content