This site uses cookies to improve your experience. To help us insure we adhere to various privacy regulations, please select your country/region of residence. If you do not select a country, we will assume you are from the United States. Select your Cookie Settings or view our Privacy Policy and Terms of Use.
Cookie Settings
Cookies and similar technologies are used on this website for proper function of the website, for tracking performance analytics and for marketing purposes. We and some of our third-party providers may use cookie data for various purposes. Please review the cookie settings below and choose your preference.
Used for the proper function of the website
Used for monitoring website traffic and interactions
Cookie Settings
Cookies and similar technologies are used on this website for proper function of the website, for tracking performance analytics and for marketing purposes. We and some of our third-party providers may use cookie data for various purposes. Please review the cookie settings below and choose your preference.
Strictly Necessary: Used for the proper function of the website
Performance/Analytics: Used for monitoring website traffic and interactions
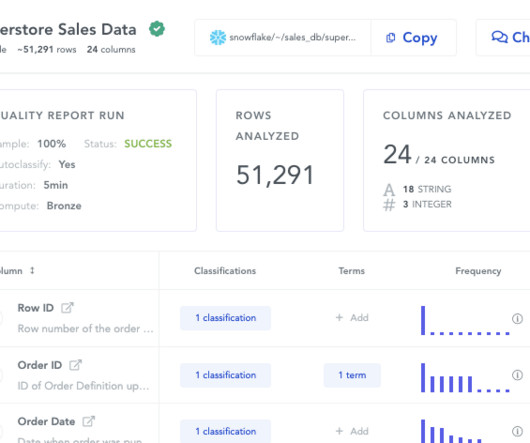
You know your product collects tons of data. Datavisualizationtools help turn your messy spreadsheets into clear, interactive insights. The best ones dont even need SQL or data science skills. Because product analytics should be easy and accessible for everyone, not just data experts.
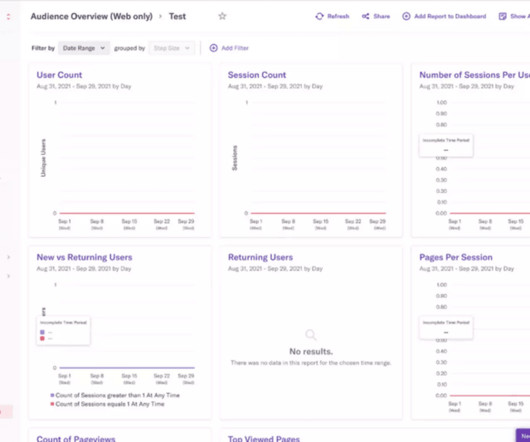
As you’re researching dashboardreportingtools, you’ve probably noticed how hard it is to find reliable information on the available solutions. TL;DR Dashboards display critical business data in real-time, streamlining decision-making and focusing on key metrics. Let’s dive in!
Known as the Martech 5000 — nicknamed after the 5,000 companies that were competing in the global marketing technology space in 2017, it’s said to be the most frequently shared slide of all time. The reasons for this growth – high-velocity economics of software innovation, the migration of money from old media to new media, etc.
Dataanalytics plays an instrumental role at every step of building a successful product. Whether you’re building your user base or releasing a new feature, the right no-code analyticsplatform can help you make evidence-based decisions. Many of these tools even come with AI capabilities. Let’s get right to it.
Think your customers will pay more for datavisualizations in your application? But today, dashboards and visualizations have become table stakes. Discover which features will differentiate your application and maximize the ROI of your embedded analytics. Brought to you by Logi Analytics.
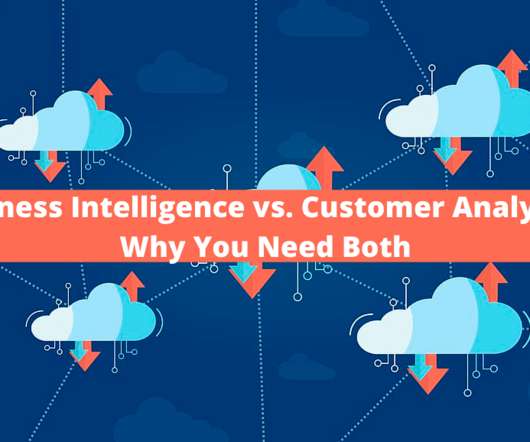
Are you struggling to make sense of scattered user data? The right customer analyticsplatform helps you uncover exactly how customers interact with your product: so you can spot issues early, optimize user journeys, and drive sustainable growth. Choose the best fit for your needs and transform data into actionable strategies.
Or rather, two – conversation topics and custom reports. Well, my panel today are no strangers to asking that same question in conversations they have with each other, as they have been instrumental in our recent release of custom reports and conversation topics. Opening new possibilities with custom reports. Thomas: Awesome.
But figuring out which sales tools you should buy and invest in – let alone what each tool even does – can be a daunting task. This is especially true when you consider the seemingly endless list of sales tools to choose from. Before we begin: how to choose your sales tools. Better tools, not more tools.
In a fast-paced industry like SaaS, leveraging business analytics effectively can be the key to staying competitive and driving product growth. Business analytics offers invaluable insights that help SaaS companies optimize operations, enhance customer experiences, and make data-driven decisions.
Visualdata surrounds us – colorful charts on weather reports, infographics on the web and in social media articles, map charts in presentations, etc. To help you get started with datavisualization, this article explores various visualization methods and their use cases. Funnel charts. Pie charts.
If you are a SaaS company, the chances are you’ve come across the term “self-serve analytics” at some point online. Unlike traditional data analysis methods, self-serve analytics equips everyone in your organization to explore data and take the right actions in real time. Choosing a good business intelligence tool.
Reveal Embedded AnalyticsData-driven companies have a hidden advantage! Theyve consistently outperformed their counterparts, reporting significantly higher metrics across operational efficiency (81% vs. 58%) , revenue growth (77% vs. 61%), and employee satisfaction (68% vs. 39%). How is this possible?
By analyzing user behavior patterns and uncovering valuable insights, behavior analyticstools enable businesses to design strategies that drive retention and business growth. Discover the cutting-edge of behavioral analyticstools! There are different types of behavioral analyticstools used in SaaS.
As you’re researching customer analyticsplatforms, you’ve probably noticed how hard it is to find reliable information on the available solutions. TL;DR Customer analyticsplatforms are specialized tools that allow you to collect and analyze data. Let’s dive in!
What is DataVisualization? More than just making numbers look pretty, datavisualization is the graphical representation of information. Graphs, charts, maps, and tables are powerful communication tools, helping to make data more accessible. Why is DataVisualization important for Product Managers?
90% of the world’s data has been created in the past 2 years, and businesses spend more than $180 billion annually on big dataanalytics. Since our first ancestors began writing on parchment, data has been an integral part of the human experience. What is big dataanalytics? But how is it used?
You reach out to all department heads and request to get data for your analysis: Marketing team for data on campaign conversion, customer support for data on call volumes, account team for data on customers feedback, product data for usage, etc. What is a product operations dashboard?
Thanks to the abundance of tools out there, marketing has never been easier. In this article, we examine some tools that can help your SaaS team to drive product growth. We will also consider valuable examples of tools that can inspire your process. The best examples are Userpilot , Hotjar , and Google Analytics.
When it comes to boosting your product growth, user tracking tools can make your life a lot easier. They offer insights into product performance , what your users are doing inside your product, and why they are doing it. But how do you know you’re picking the right tools? Amplitude is the best event-tracking software.
Experts predict the Customer Analytics market will top $24 billion by 2025. That growth is driven by a common difficulty facing many of today’s businesses—mountains of data and no way for non-technical people to make sense of it. That’s where Customer Analytics comes in. Common Customer Analytics Features.
That’s where customer engagement software comes in. The right platform will equip you with the tools to interact effectively, gather valuable feedback, and build lasting customer relationships. Integrations with other tools: Does it integrate with CRM, marketing automation, and other essential business applications?
We will be using Airbyte (an open-source data integration platform) and Tableau (a business intelligence and analyticssoftware) for this tutorial. Step 1: Replicating Zoom data to PostgreSQL Launching Airbyte In order to replicate Zoom data, we will need to use Airbyte’s Zoom connector.
Every company, of every size — even organizations of just one person — are navigating a data avalanche problem. Every team — from product to marketing, and IT to engineering — is generating data. A strong analytics stack is foundational to being able to make sense of it all. What Technology Do You Need in Your Stack?
Yesterday we launched powerful upgrades to the Intercom platform for support teams. We’ve always used Intercom to provide support for our customers and, as our customer base has grown, we’ve seen first hand the needs for better reporting and workflows in Intercom. Customizable Inbox views that help you track key conversations.
TL;DR A business intelligence (BI) analyst is a data specialist who helps businesses translate raw data into actionable insights. According to Glassdoor data, the estimated total pay for a Business Intelligence Analyst in the United States is $134,912 per year, with a base salary of $99,503 and additional pay of $35,409.
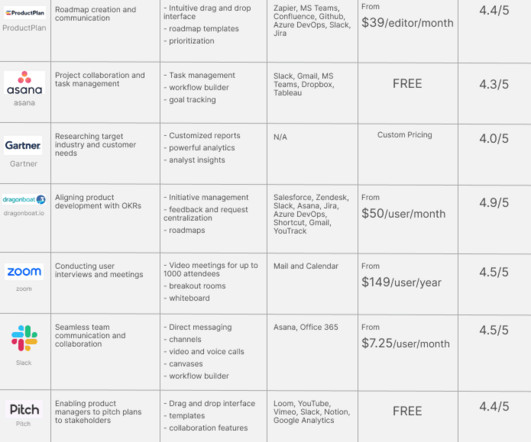
It takes a fair bit of effort and time to keep up with the constant innovation in the product management software space. The tools are constantly evolving and changing their pricing plans, so it may be difficult to ensure that your product team is using the right tools and getting the best value for the money.
G2 has named Indicative as a Leader in Customer Journey Analytics in G2’s 2020 Summer Report. . Indicative is the only Customer Analyticsplatform designed specifically for non-technical business users that connects directly to your data warehouse. High Performer in Digital Analytics. Why We’re Leaders.
Searching for the best software for customer feedback to truly understand your customer sentiment ? Software for customer feedback has become essential for SaaS businesses that have customers in their hearts. Actionable insights from feedback help you better align your product with customers’ needs and retain them for longer.
How to promote data democratization in your SaaS business to improve decision-making ? TL;DR Data democratization is the process of simplifying how data is stored and managed to help non-technical employees access it easily and make data-driven decisions. What is data democratization?
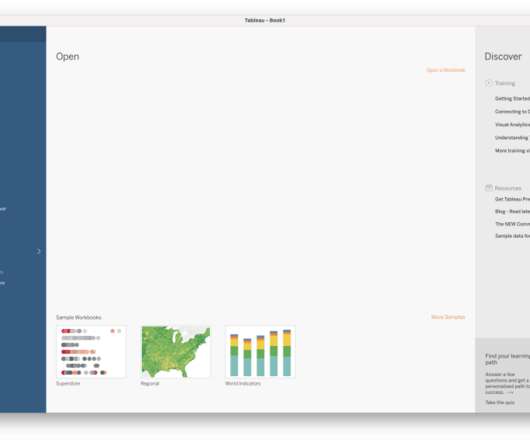
Reveal Embedded Analytics. Among all embedded analytics products on the market, Tableau is certainly one of the most popular BI tools for analyzing, visualizing, and working with data. Tableau has been helping businesses to transform raw data into valuable insights for more than 16 years.
Tracking cross-platformanalytics is essential for product teams to see a complete view of customer behavior. TL;DR Cross-platformanalytics is the activity of tracking and analyzing user behavior across multiple platforms or devices. What is cross-platformanalytics?
In 2019, industry-leading Business Intelligence tools (BI tools), Looker and Tableau, were acquired by Google and Salesforce for over $18 billion combined. These massive deals show that BI tools and data warehouses are a powerful combo that companies across the globe are incorporating into their tech stacks.
To help teams work differently, but together, we’re investing in the Atlassian platform – a common technology foundation across our apps that connects teams while allowing them to work with the tools of their choice. Atlassian Data Lake: data from the Atlassian portfolio of apps in one queryable place.
A product analyst needs to be able to utilize data strategically, but their job description doesn’t depend on data science degrees anymore. This change has been primarily driven by increased access to analyticstools like Userpilot that help businesses achieve product growth. What is a product analyst?
Reveal Embedded Analytics. Choosing the right embedded analyticsplatform for your business needs is paramount. Table of contents: What are embedded analyticsplatforms? Embedded analytics benefits Top 7 embedded analyticsplatforms Reveal Looker Toucan Sisense Logi analyticsTableau Power BI.
Key Tasks User issues reports. Identify key quality metrics and create dashboards to track real-time product health. Bug Service Level Agreement (SLA). Bug Service Level Agreement (SLA). Implement project management software and establish standards for tracking and reporting on progress across teams.
Data is the most valuable asset of our time. Part of the challenge is that the language of data isn’t always intuitive to our very human minds. So, we rely on software, spreadsheets, and statistical packages to make our best judgment calls. Every company in the world needs data to strengthen its competitive footing.
Do you need to worry about data discrepancy? More importantly, we will show you: How to identify them What causes data discrepancies And how to leverage product analyticstools to avoid the issue Let’s dive in! To identify data discrepancies, first cross-reference different data sources and look for inconsistencies.
In 2017, Gartner introduced the concept augmented analytics in his Augmented Analytics is the Future of Data and Analyticsreport. In broader terms, the concept can be defined as data preparation and presentation through the use of machine learning and natural language processing (spoken or written).
We also explore: Different types of product analysis The steps needed to analyze your product The tools you can use Let’s get right to it! TL;DR Product analysis is the process of collecting and analyzing data about various aspects of product performance. Next, collect data from the right sources and analyze it.
How do you create top-notch data analysis reports? It also covers: Why you need data analysis reports. Different types of reports. Best analyticstools for creating data analysis reports. Trend analysis reports track patterns and shifts in data over time.
Are you looking for Zendesk integrations to boost the efficiency of your self-service customer support? The article explores the best Zendesk integrations for: Customer support Customer feedback Productivity Email and social media communication Analytics and reporting Let's get right to it! If so, you’re in the right place!
Embarking on a career as a customer insights manager involves a combination of education, skills development, and practical experience. This guide will provide you with a comprehensive overview of the path to becoming a successful customer insights manager. Let’s dive in!
Embarking on a career as a customer service representative involves a combination of education, skills development, and practical experience. This guide will provide you with a comprehensive overview of the path to becoming a successful customer service representative. Looking into tools for customer service representatives?
We organize all of the trending information in your field so you don't have to. Join 96,000+ users and stay up to date on the latest articles your peers are reading.
You know about us, now we want to get to know you!
Let's personalize your content
Let's get even more personalized
We recognize your account from another site in our network, please click 'Send Email' below to continue with verifying your account and setting a password.


Let's personalize your content