This site uses cookies to improve your experience. To help us insure we adhere to various privacy regulations, please select your country/region of residence. If you do not select a country, we will assume you are from the United States. Select your Cookie Settings or view our Privacy Policy and Terms of Use.
Cookie Settings
Cookies and similar technologies are used on this website for proper function of the website, for tracking performance analytics and for marketing purposes. We and some of our third-party providers may use cookie data for various purposes. Please review the cookie settings below and choose your preference.
Used for the proper function of the website
Used for monitoring website traffic and interactions
Cookie Settings
Cookies and similar technologies are used on this website for proper function of the website, for tracking performance analytics and for marketing purposes. We and some of our third-party providers may use cookie data for various purposes. Please review the cookie settings below and choose your preference.
Strictly Necessary: Used for the proper function of the website
Performance/Analytics: Used for monitoring website traffic and interactions
How to plan a dashboard people will use: 10 Key Steps Dashboard user interface elements in light and dark modes Our team has built dashboards for a wide range of businesses, and we’ve picked up a few key insights along the way. A truly functional dashboard is always the result of collaboration.
You know your product collects tons of data. Datavisualizationtools help turn your messy spreadsheets into clear, interactive insights. The best ones dont even need SQL or data science skills. Because product analytics should be easy and accessible for everyone, not just data experts.
Are you struggling to make sense of scattered user data? The right customer analytics platform helps you uncover exactly how customers interact with your product: so you can spot issues early, optimize user journeys, and drive sustainable growth. Choose the best fit for your needs and transform data into actionable strategies.
Reveal Embedded AnalyticsData-driven companies have a hidden advantage! Theyve consistently outperformed their counterparts, reporting significantly higher metrics across operational efficiency (81% vs. 58%) , revenue growth (77% vs. 61%), and employee satisfaction (68% vs. 39%). How is this possible?
Think your customers will pay more for datavisualizations in your application? But today, dashboards and visualizations have become table stakes. Discover which features will differentiate your application and maximize the ROI of your embedded analytics. Brought to you by Logi Analytics.
Reveal Embedded Analytics Today’s business users expect more than static dashboards or delayed reports. They want to explore live data, uncover insights, and take action in real time. Traditional BI tools were not built for embedded use cases. This is where embedded self-service BI comes in.
The right platform will equip you with the tools to interact effectively, gather valuable feedback, and build lasting customer relationships. How I chose the best customer engagement software My evaluation process combined thorough feature analysis , a careful review of user feedback, and insights from industry reports.
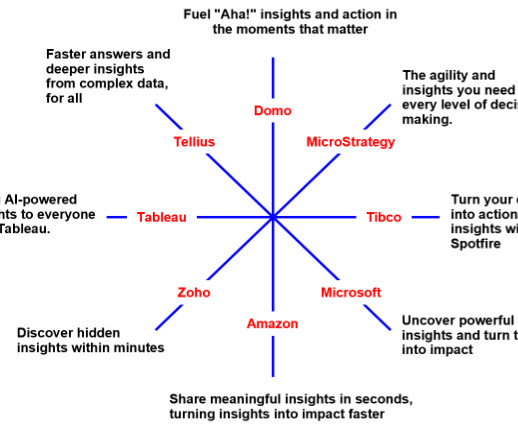
Messages that Matter Messages that Matter Assessment explains how BI vendors can easily solve the problem By Lawson Abinanti, Messages that Matter For the 10th year in a row, lack of differentiation permeates the Business Intelligence & Analytics market which made me imagine why and how to solve the problem.
The predictable result? Reports in different numbers” even when everyone is “trying to report on the same metrics”. Reports in different numbers” even when everyone is “trying to report on the same metrics”. Annual tool cost: ~$150 K. Head-count just to wrangle reports: ~$800 K.
Download this guide for practical advice on how to use a semantic layer to unlock data for AI & BI at scale. Read this guide to learn: How to make better, faster, and smarter data-driven decisions at scale using a semantic layer. How to enable data teams to model and deliver a semantic layer on data in the cloud.
Think PMs who can hold their own in a technical architecture meeting, sketch out wireframes in Figma without panicking, or dig into metrics without asking a data analyst to do it for them. AI tools can absolutely make your job easier. And the PMs who can harness AI and speak tech/data/design fluently? These are the hybrid PMs.
With solutions ranging from simple recording tools to full-featured analytics platforms, the big question is whether to choose a standalone tool or an all-in-one solution. Whether you’re evaluating your first tool or considering a switch, you’ll learn exactly what to look for – and what to avoid.
Data-driven decision-making: Strong analytical skills, with the ability to use data to drive decision-making and measure success. This team works on high-impact projects that aim to amplify our global user base and drive the long-term growth of our products through data analysis, value creation, and experimentation.
Subscribe now For more: Lennybot | Podcast | Swag | Hire your next product leader | My favorite courses I’ve always been fascinated by what tools people choose to use in their work. Today, with insights from over 6,500 of you (thank you! As the third-most-used tool overall, Slack continues to crush it. 5% use Bolt.
Data analysts have become a key part of how companies operate, innovate, and grow in an era where data drives nearly every decision. The role of a data analyst is deeply embedded across teams, from streamlining business operations to driving strategic product decisions. But what exactly does a data analyst do?
Matching these solutions to the assorted challenges product managers face can be a little tricky, so we’ve done some digging to compile a handy list of product management tools. Data Analysis Tools for Product Management. Products can’t move forward without proper datavisualization and analysis.
Below, we discuss how to prepare for and ace data engineering interviews. 🧠 About this guide : Written by Thang Tran , a senior data engineer (ex-Amazon, Meta, and Apple) and Exponent interview coach. Reviewed by Deeptaanshu Kumar, a VP of data engineering (ex-Capital One, Freddie Mac).
These are some of the most common data analyst interview questions. ✅ Verified : Celine Liu , Uber's former Global Analytics Lead, wrote this guide. Celine has conducted 100+ interviews across analytics, operations, and strategic roles. 🧠 Learn more : Check out our complete data analyst interview prep course.
Below, we'll show you how to write the perfect data analyst resume. Highlight the most relevant projects that align with the goals of the data analyst role you're applying for. Highlight the most relevant projects that align with the goals of the data analyst role you're applying for.
As you’re researching dashboardreportingtools, you’ve probably noticed how hard it is to find reliable information on the available solutions. TL;DR Dashboards display critical business data in real-time, streamlining decision-making and focusing on key metrics. Let’s dive in!
Visualdata surrounds us – colorful charts on weather reports, infographics on the web and in social media articles, map charts in presentations, etc. To help you get started with datavisualization, this article explores various visualization methods and their use cases. Funnel charts. Pie charts.
You reach out to all department heads and request to get data for your analysis: Marketing team for data on campaign conversion, customer support for data on call volumes, account team for data on customers feedback, product data for usage, etc. What is a product operations dashboard?
Dataanalytics plays an instrumental role at every step of building a successful product. Whether you’re building your user base or releasing a new feature, the right no-code analytics platform can help you make evidence-based decisions. Many of these tools even come with AI capabilities. Let’s get right to it.
What is DataVisualization? More than just making numbers look pretty, datavisualization is the graphical representation of information. Graphs, charts, maps, and tables are powerful communication tools, helping to make data more accessible. Why is DataVisualization important for Product Managers?
By analyzing user behavior patterns and uncovering valuable insights, behavior analyticstools enable businesses to design strategies that drive retention and business growth. Discover the cutting-edge of behavioral analyticstools! There are different types of behavioral analyticstools used in SaaS.
We will be using Airbyte (an open-source data integration platform) and Tableau (a business intelligence and analytics software) for this tutorial. Step 1: Replicating Zoom data to PostgreSQL Launching Airbyte In order to replicate Zoom data, we will need to use Airbyte’s Zoom connector.
What Google’s and Salesforce’s respective acquisition of Looker and Tableau Software means for CIO’s The BI analyticstool space is consolidating to compete against Microsoft’s ensemble of Business Analytics(BA) products which promises to solve for the entire workflow?—?data Because Data is the new currency.
90% of the world’s data has been created in the past 2 years, and businesses spend more than $180 billion annually on big dataanalytics. Since our first ancestors began writing on parchment, data has been an integral part of the human experience. What is big dataanalytics? But how is it used?
Empowering Product Managers with Data-Driven Strategies In the dynamic landscape of modern business, the role of a Product Manager has evolved beyond mere product delivery to orchestrating experiences that align seamlessly with both customer needs and overarching business goals. Imagine you’re steering a health and wellness app.
In a fast-paced industry like SaaS, leveraging business analytics effectively can be the key to staying competitive and driving product growth. Business analytics offers invaluable insights that help SaaS companies optimize operations, enhance customer experiences, and make data-driven decisions.
Or rather, two – conversation topics and custom reports. Well, my panel today are no strangers to asking that same question in conversations they have with each other, as they have been instrumental in our recent release of custom reports and conversation topics. Opening new possibilities with custom reports. Thomas: Awesome.
If you are a SaaS company, the chances are you’ve come across the term “self-serve analytics” at some point online. Unlike traditional data analysis methods, self-serve analytics equips everyone in your organization to explore data and take the right actions in real time. Choosing a good business intelligence tool.
But figuring out which sales tools you should buy and invest in – let alone what each tool even does – can be a daunting task. This is especially true when you consider the seemingly endless list of sales tools to choose from. Before we begin: how to choose your sales tools. Better tools, not more tools.
As you’re researching customer analytics platforms, you’ve probably noticed how hard it is to find reliable information on the available solutions. TL;DR Customer analytics platforms are specialized tools that allow you to collect and analyze data. Starts at Tableau Viewer’s $15/month billed annually.)
Experts predict the Customer Analytics market will top $24 billion by 2025. That growth is driven by a common difficulty facing many of today’s businesses—mountains of data and no way for non-technical people to make sense of it. That’s where Customer Analytics comes in. Common Customer Analytics Features.
If you are wondering how actionable analytics can help you boost product growth in 2023, this post is for you! In this article, we cover everything about different types of actionable analytics, how to collect those actionable insights and the best tools you can use to harness the analyticaldata.
When it comes to boosting your product growth, user tracking tools can make your life a lot easier. They offer insights into product performance , what your users are doing inside your product, and why they are doing it. But how do you know you’re picking the right tools? Tableau is the best user datavisualizationtool.
The “shiny penny” approach (focus all your attention on the hottest tools in the market) or “head in the sand” approach (fall victim to analysis paralysis and avoid choosing any tools) are no longer viable. But here’s the thing: a tool is not a strategy. The anatomy of a marketing tech stack [with recommended tools].
In SaaS, the top dataanalytics trends can either be a revolution or just fluff. So what are the trends in the dataanalytics landscape that are actually important for product management ?
We’ve always used Intercom to provide support for our customers and, as our customer base has grown, we’ve seen first hand the needs for better reporting and workflows in Intercom. So over the years, we’ve been able to build internal tools to cater to our team needs. New conversation data attributes to drive customer insights.
Reveal Embedded Analytics. Among all embedded analytics products on the market, Tableau is certainly one of the most popular BI tools for analyzing, visualizing, and working with data. Tableau has been helping businesses to transform raw data into valuable insights for more than 16 years.
How can product managers keep tabs on all the KPIs necessary to make informed product decisions without getting swamped with all the irrelevant data out there? The short answer is: with product dashboards! We also explore tools for building product dashboards and data analysis. What are product dashboards?
Every company, of every size — even organizations of just one person — are navigating a data avalanche problem. Every team — from product to marketing, and IT to engineering — is generating data. A strong analytics stack is foundational to being able to make sense of it all. Data Tracking and Collection. Event Data.
Everyone talks about getting insights from digital products and processes, yet I’ve seen it done wrong so many times that the subject demands revisiting, especially in light of the emerging field of DataOps. Data is increasingly complex and complexity can only be managed via stable and reliable foundations. What is an Insight?
We organize all of the trending information in your field so you don't have to. Join 96,000+ users and stay up to date on the latest articles your peers are reading.
You know about us, now we want to get to know you!
Let's personalize your content
Let's get even more personalized
We recognize your account from another site in our network, please click 'Send Email' below to continue with verifying your account and setting a password.


Let's personalize your content