This site uses cookies to improve your experience. To help us insure we adhere to various privacy regulations, please select your country/region of residence. If you do not select a country, we will assume you are from the United States. Select your Cookie Settings or view our Privacy Policy and Terms of Use.
Cookie Settings
Cookies and similar technologies are used on this website for proper function of the website, for tracking performance analytics and for marketing purposes. We and some of our third-party providers may use cookie data for various purposes. Please review the cookie settings below and choose your preference.
Used for the proper function of the website
Used for monitoring website traffic and interactions
Cookie Settings
Cookies and similar technologies are used on this website for proper function of the website, for tracking performance analytics and for marketing purposes. We and some of our third-party providers may use cookie data for various purposes. Please review the cookie settings below and choose your preference.
Strictly Necessary: Used for the proper function of the website
Performance/Analytics: Used for monitoring website traffic and interactions
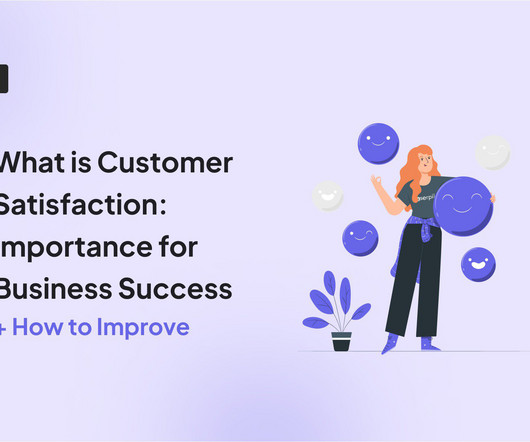
According to the American CustomerSatisfaction Index , with an ACSI score of 78.0, overall customersatisfaction in America was the highest it has ever been in Q1 2024. However, while some companies have managed to improve their customersatisfaction levels and benefit from it, many have not.
Onboarding gamification is the key to transforming a dull process into an engaging one. When the process feels complicated, it becomes easy for a new user to lose interest before they experience the true value of your product. What is onboarding gamification? Launching a new product.
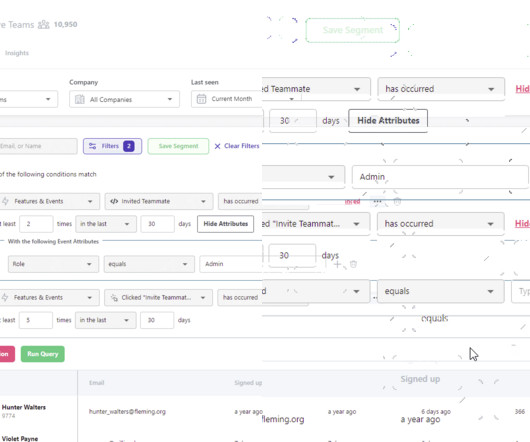
Thats why you need user session analysis. By combining contextual insights from session replays , heatmaps, and behavior analytics, user session analysis helps you interpret metrics through the lens of real user journeys. On the surface, it looks like a win. Tools can track every click and interaction.
Without measuring and aggressively improving the right mobile app metrics, youll struggle to stay afloat. churn within 30 days, and in-app purchase conversion rates are often below 5% for the small number of users who remain. The key is to understand your users and continuously optimize your mobile app for exceptional value.
Guest Post by: Marvin Mathew (Mentee, Session 11, The Product Mentor) [Paired with Mentor, Jordan Bergtraum]. Ruthless prioritization translates to product teams spending time building the right thing at the right time. Our objective is to understand customer needs and adjusting. . And per customer? It’s cyclical.
Can you imagine what the ideal SaaS customeronboarding process looks like? When done well, it can be the difference between a user becoming a loyal customer or churning after the first week. These will include: Userpilot Miro Slack Amplitude Mailchimp Airtable Loom Grammarly What is a SaaS onboarding process?
Poor performance includes slow loading times, complex design, confusing navigation, and unresponsive features. Basically, anything that ruins the user experience. This article will help reduce such churn by refining your product management and UX analysis approach. How to start your UX analysis.
To provide this, you must understand how your customer experience stacks up against these expectations. This is where metrics can be invaluable, giving clarity on performance, and circumventing potential issues. But with so much data to consider, how can you define the help desk metrics that matter for your team?
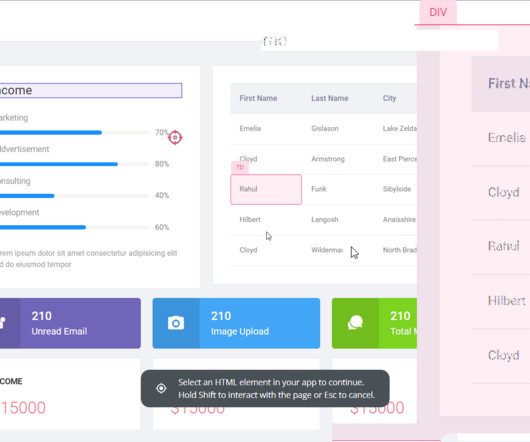
With an abundance of product analytics to track, having a robust SaaS KPI dashboard is essential to monitor the metrics that matter most. TL;DR A SaaS dashboard can be used to track important metrics and key performance indicators. Your custom SaaS dashboard should provide actionable data and be as automated as possible.
It’s no secret that learning how to evaluate product performance is essential for product management. But how can you effectively measure productmetrics that can help you reach your goals and increase revenue growth? Why not book a Userpilot demo to see how you can analyze and improve product performance continuously?
Tracking the right usermetrics helps you precisely identify issues in the product experience rather than feeling lost in a sea of data. Choosing the wrong KPIs can be more damaging than you think – it drains your teams resources, shifts focus away from real problems, and ultimately, disrupts the customer experience.
Try to understand what the in-app user journey is like. Why aren’t app users engaging with it more? And how can you turn them into active users? This is where these 10 key mobile app engagement metrics come in, helping track user behavior and preferences to answer all these questions and boost user activation.
Customersatisfaction analytics are key to understanding what makes your customers happy and building a product that retains users. But how can you leverage this user sentiment data to lead product development and grow your business? There’s no single KPI to measure customersatisfaction.
Think of Net Promoter Score (NPS) software as a tool to measure your customers’ feelings about your product, and categorize them based on their level of loyalty (promoters, neutrals, and detractors). The great advantage of these tools is that they streamline the creation, distribution, and analysis of NPS surveys.
Most product teams get mobile app analytics wrong. They track 47 different key performance indicators (KPIs) in their mobile analytics platform , spend hours debating dashboard numbers, yet can’t predict which users will churn next week The problem here isn’t a lack of data.
Let’s review everything your customer success team has to do in the absence of any customer success tools. Collect customer data to calculate complex formulas for tracking metrics, monitor customer health scores, and resolve support tickets while continuously trying to improve retention and expansion.
A customer expansion strategy is a playbook for increasing the revenue from your existing customers, for example, by selling them additional products and services or encouraging them to upgrade to higher plans. How to calculate customer expansion revenue? To realize the full value of the product, users need to upgrade.
You see, although we work hard to make Userpilot the best product adoption tool on the market, we know it isnt the perfect fit for every business. Helping prospects find the right product is a win-win situation. Userpilots key features include: No-code Chrome extension for building in-app flows. Pendo The dashboard on Pendo.
What is product experience? Product experience refers to the customer journey that takes place within the product itself, from a person’s first login to their last time using the application. It is a broader, more end-to-end view of user experience, which refers to specific interactions a person has within a product.
At Userpilot, NPS is an integral part of our product. This is mainly because NPS was sold as a quantitative metric that is the ultimate indicator of growthespecially in product management. This metric ended up being adopted by companies in every industry. However, so many companies use it to measure satisfaction.
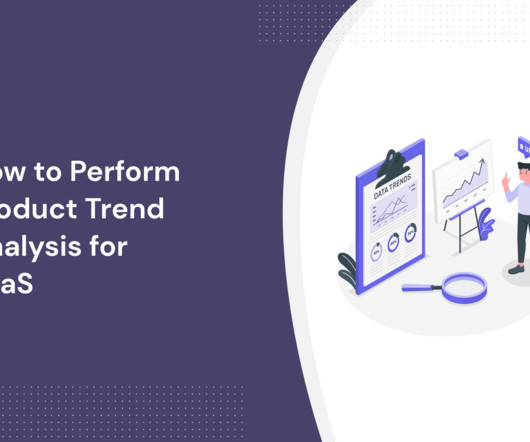
Trend analysis reports help you make data-driven decisions that boost SaaS performance metrics such as user activation, product stickiness, and retention. This article helps answer core trend analysis questions. TL;DR Trend analysis is the process of tracking and analyzing changes in key metrics over time.
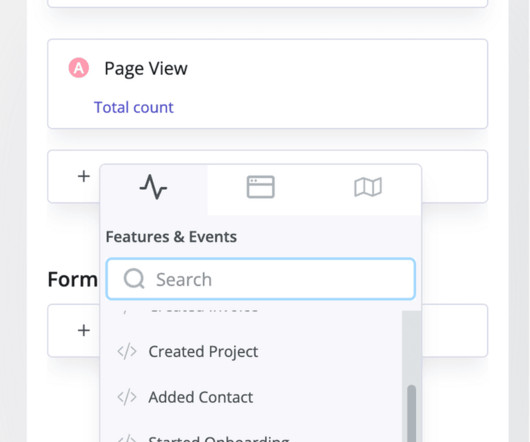
Tracking product analytics , such as feature usage, is useful for understanding feature adoption and user engagement. Plus, it also helps gain valuable insights on how to enhance the customer experience and improve user retention. Metrics selection – which key metrics are most relevant to your goal?
Performing trend and product analytics can help you make data-backed informed decisions to stay ahead of the competition. With trend analysis, you’ll be able to better understand both internal and external factors affecting your business operations.
Does the thought of quantitative data analysis bring back the horrors of math classes? But conducting quantitative data analysis doesn’t have to be hard with the right tools. Want to learn how to turn raw numbers into actionable insights on how to improve your product? Defining goals and KPIs. Visualizing the data.
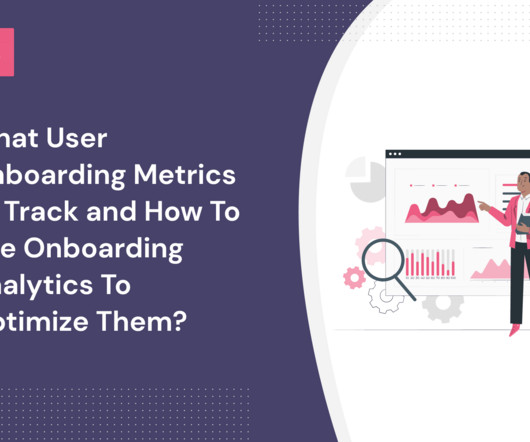
What useronboardingmetrics should you track if you want to evaluate your onboarding processes? We all know that successful onboarding is especially important for SaaS companies since they depend on a subscription-based business model. Track in-app feature usage to identify and remove friction points.
It’s crucial to listen to the voice of the customer and let their feedback guide your company’s growth and sustainability. And to do that, you must ask the right customersatisfaction survey questions. Here are some best practices for collecting customer feedback. What is a customersatisfaction survey?
Customer experience (CX) is central to product management and the success of your SaaS platform. It can help retain customers and gain loyal brand advocates. And that’s why the customer experience software solutions you choose matter greatly. Userpilot helps you with customer engagement and data management.
What happens when you build a product or service around what you think potential customers want, only for them to buy something else? For starters, it shows you dont know your customers well enough. But worse than that, it leads to lower revenue, failed products, and plummeting customer loyalty.
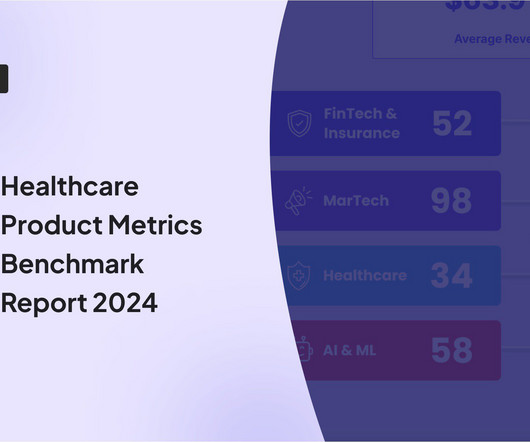
Userpilot’s SaaS ProductMetrics Benchmark Report has found that compared to other industries, healthcare SaaS companies perform lower across most of the 6 metrics we studied. You will also learn how healthcare companies can improve their productmetrics. Onboarding checklist completion rate. Time to Value.
According to Userpilot’s SaaS Product Success Metrics Benchmark report , Fintech and Insurance companies had the second-lowest activation and adoption rates of all industries. This is because the client onboarding process in financial services faces unique challenges. What are they? Let’s get started.
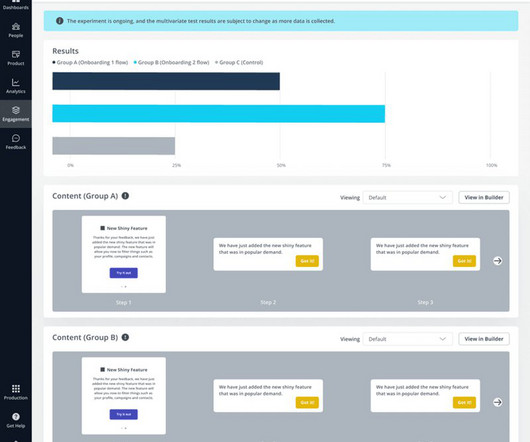
Incorporating these tools into your customer experience tech stack will drive more engagement, deliver high-quality customer feedback, and help inform your product roadmap. Apptimize can help brands create powerful audience segments, identify the cause of conversion funnel drop-offs, and test new features.
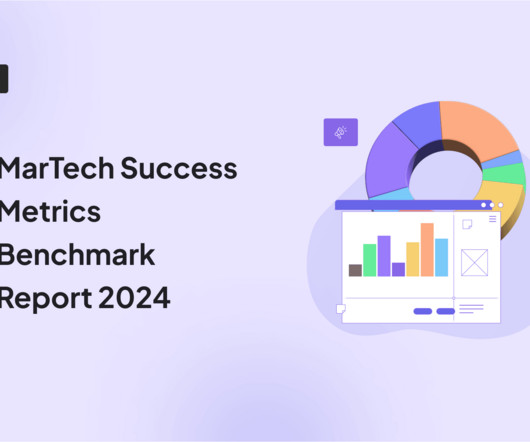
MarTech companies had the lowest onboarding c completion rates of all the industries we studied for our SaaS ProductMetrics Benchmark Report. Does it have any impact on new user activation, time-to-value, or other metrics? We also show you how you can improve the key success metrics for your MarTech SaaS.
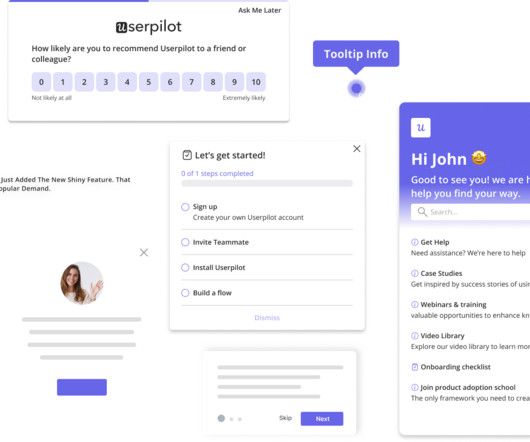
An interactive user guide is a set of UI patterns designed to work together and help customers understand how to use your product. Why are interactive user guides important? All product managers want to delight and engage their customers. Users get access to help just when they need it.
Want to track the different types of productmetrics to get product growth insights ? Productmetrics are critical for product growth managers to develop the right product strategies and drive continuous value for customers. You can also use a productmetrics framework, ie.
With so many options out there for consumers, the FinTech onboarding process is crucial for any FinTech company looking to set itself apart. As with every digital product, the first few minutes on your app will determine whether the user sticks with it or abandons it. to assist customers at all times.
A product adoption dashboard helps you visualize key adoption metrics so you can make data-driven decisions and boost user engagement. In this article, we cover the following: Why you need a product adoption dashboard. The most important metrics to track and why they matter. Understand how users adopt new features.
How does customeronboarding in banking work? You will also learn the main challenges involved in the onboarding process in banking, best practices and explore the best onboarding software tools for the job. The process establishes the foundation for the bank-customer relationship. Let’s dive right in!
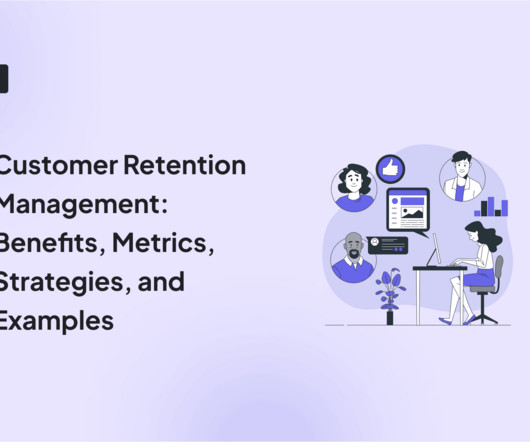
Effective customer retention strategies enhance customersatisfaction , turning repeat customers into brand advocates who attract new customers through positive word-of-mouth. Other retention metrics to track include product stickiness, customer lifetime value, expansion MRR, and NPS scores.
How do you perform a customer churn analysis that gives you the necessary insights to boost retention and grow your SaaS business ? TLDR; Customer churn analysis involves measuring and interpreting data to find out why customers churn. The first step to managing churn is to conduct a churn analysis.
Do you know which product health metrics to track to achieve long-term success for your SaaS business? The right metrics and data will offer valuable product growth insights to help you make data-driven decisions about optimizing your products’ performance. What are product health metrics?
” And that’s also why AARRR metrics are called pirate metrics. Short for acquisition, activation, retention, referral, and revenue, these metrics help you measure and drive product growth. In this article, we’ll dig deeper into the AARRR framework and the relevant metrics associated with each stage.
Period-over-period analysis is one of the key ways to drive sustainable SaaS growth. The data obtained from the process lets you adapt and refine your strategies, ensuring you make proactive moves to improve key growth metrics. This article shows you: Five simple steps to perform period-over-period analysis.
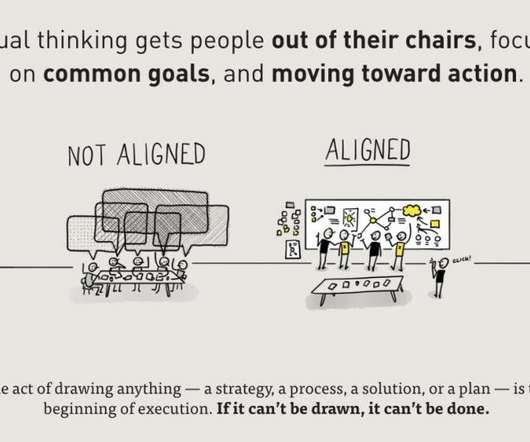
Data analysis is integral to a product manager’s job – it’s what helps them build impactful products. This article dives deep into data analysis for product managers. This approach is vital in modern product management , and every product manager needs to embrace it.
Through case studies, statistical evidence, and methodological frameworks, I aimed to establish how systematic user research can positively impact key business metrics, from acquisition to referral. This striking statistic illustrates the potential impact when growth decisions are grounded in robust user research.
We organize all of the trending information in your field so you don't have to. Join 96,000+ users and stay up to date on the latest articles your peers are reading.
You know about us, now we want to get to know you!
Let's personalize your content
Let's get even more personalized
We recognize your account from another site in our network, please click 'Send Email' below to continue with verifying your account and setting a password.


Let's personalize your content