This site uses cookies to improve your experience. To help us insure we adhere to various privacy regulations, please select your country/region of residence. If you do not select a country, we will assume you are from the United States. Select your Cookie Settings or view our Privacy Policy and Terms of Use.
Cookie Settings
Cookies and similar technologies are used on this website for proper function of the website, for tracking performance analytics and for marketing purposes. We and some of our third-party providers may use cookie data for various purposes. Please review the cookie settings below and choose your preference.
Used for the proper function of the website
Used for monitoring website traffic and interactions
Cookie Settings
Cookies and similar technologies are used on this website for proper function of the website, for tracking performance analytics and for marketing purposes. We and some of our third-party providers may use cookie data for various purposes. Please review the cookie settings below and choose your preference.
Strictly Necessary: Used for the proper function of the website
Performance/Analytics: Used for monitoring website traffic and interactions
The right customer analyticsplatform helps you uncover exactly how customers interact with your product: so you can spot issues early, optimize user journeys, and drive sustainable growth. With a reliable analyticssolution , you wont miss critical signals or overlook game-changing insights that could increase product adoption.
Cascade: UI Elements in Light Mode Templates and AI tools can help in spots, but they don’t feel your context or see every nuance. In the wrong hands, they can turn a helpful tool into a harmful one. Admin analytical dashboard for the fitness app Step 1. A tool for everyone usually helps no one.
Reveal Embedded Analytics Data-driven companies have a hidden advantage! Leaders across industries are recognizing this and moving fast to prioritize data democratizationensuring data is accessible to everyoneas a foundation of their SaaS development. How is this possible?
Reveal Embedded Analytics Today’s business users expect more than static dashboards or delayed reports. However, delivering that experience inside a software product or platform is not easy. However, delivering that experience inside a software product or platform is not easy.
Discover which features will differentiate your application and maximize the ROI of your embedded analytics. Brought to you by Logi Analytics. But today, dashboards and visualizations have become table stakes.
That’s where customer engagement software comes in. The right platform will equip you with the tools to interact effectively, gather valuable feedback, and build lasting customer relationships. Integrations with other tools: Does it integrate with CRM, marketing automation, and other essential business applications?
Data visualization tools help turn your messy spreadsheets into clear, interactive insights. Because product analytics should be easy and accessible for everyone, not just data experts. So where do you find the right tools? What are data visualization tools? How do data visualization tools help product teams?
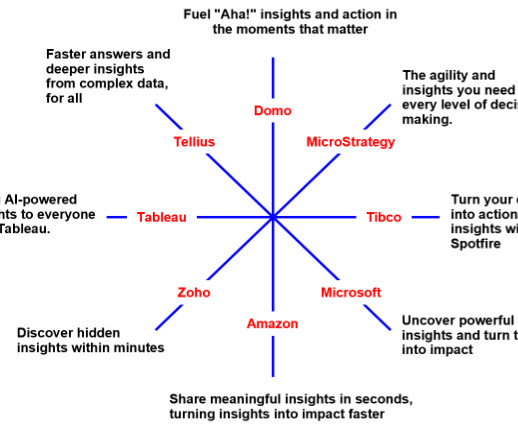
Messages that Matter Messages that Matter Assessment explains how BI vendors can easily solve the problem By Lawson Abinanti, Messages that Matter For the 10th year in a row, lack of differentiation permeates the Business Intelligence & Analytics market which made me imagine why and how to solve the problem. What is a position?
Looking for the perfect session replay platform but feeling lost in the sea of options? With solutions ranging from simple recording tools to full-featured analyticsplatforms, the big question is whether to choose a standalone tool or an all-in-one solution. You’re not alone.
How to achieve speed of thought query performance and consistent KPIs across any BI/AI tool, such as Excel, Power BI, Tableau, Looker, DataRobot, Databricks and more. How to enable data teams to model and deliver a semantic layer on data in the cloud.
Data-driven decision-making: Strong analytical skills, with the ability to use data to drive decision-making and measure success. OpenAI: B2B Growth, Lifecycle As part of the Growth team, you’ll be at the forefront of bringing OpenAI’s technology to the world. Who would be a bad fit for this job?
The Before-and-After Story: Heavy Stack ➜ Self-Service Product Analytics Before: At Tanya’s previous unicorn, data lived in a “very massive and cumbersome” stack: ETL pipelines, Snowflake, Tableau and Amplitude. Annual tool cost: ~$150 K. 31–60 days Layer on a self-service BI tool. The predictable result?
Subscribe now For more: Lennybot | Podcast | Swag | Hire your next product leader | My favorite courses I’ve always been fascinated by what tools people choose to use in their work. ” we asked people what tools they most love, what tools frustrate them, and what they’d change if they could. 5% use Bolt.
✅ Verified : Celine Liu , Uber's former Global Analytics Lead, wrote this guide. Celine has conducted 100+ interviews across analytics, operations, and strategic roles. These roles are often variations of the same core responsibilities, with slight differences in tools, scope, or domain expertise.
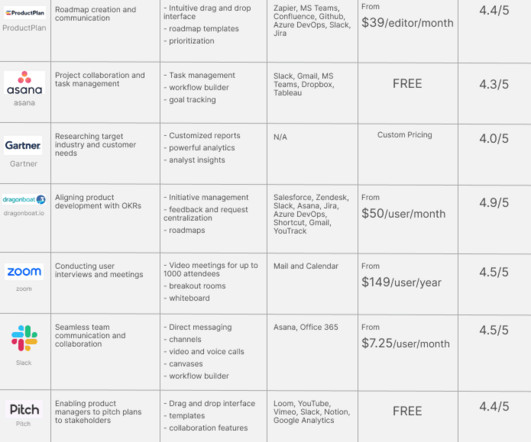
The litany of tasks on a PM’s plate can seem overwhelming at a glance, but the market has responded to these challenges with a number of specialized solutions that many PMs now consider indispensable in their day-to-day. Data Analysis Tools for Product Management. User Research Tools for Product Managers.
Software vs. Data Engineering Interviews At a high level, both software and data engineering interviews follow a familiar structure. ℹ️ Some organizations, such as Meta , have separate data engineering and software engineering loops. You could go through both in the same year without interviewing conflicts.
✅ Verified : Celine Liu , Uber's former Global Analytics Lead, wrote this guide. Celine has conducted 100+ interviews across analytics, operations, and strategic roles. Business Case Round: Assesses your analytical thinking and business acumen with open-ended scenarios.
🧠 Check out our complete data analytics interview prep course. Data-Driven Work Experience Each bullet starts with an action verb and showcases measurable achievements (e.g., " Developed an automated revenue reporting system, improving response time by 40% "). ✅ Passes the ATS (Applicant Tracking System) filters.
Known as the Martech 5000 — nicknamed after the 5,000 companies that were competing in the global marketing technology space in 2017, it’s said to be the most frequently shared slide of all time. The reasons for this growth – high-velocity economics of software innovation, the migration of money from old media to new media, etc.
What Google’s and Salesforce’s respective acquisition of Looker and TableauSoftware means for CIO’s The BI analyticstool space is consolidating to compete against Microsoft’s ensemble of Business Analytics(BA) products which promises to solve for the entire workflow?—?data last week and Salesforce’s $15.3b
But figuring out which sales tools you should buy and invest in – let alone what each tool even does – can be a daunting task. This is especially true when you consider the seemingly endless list of sales tools to choose from. Before we begin: how to choose your sales tools. Better tools, not more tools.
As you’re researching customer analyticsplatforms, you’ve probably noticed how hard it is to find reliable information on the available solutions. TL;DR Customer analyticsplatforms are specialized tools that allow you to collect and analyze data. Let’s dive in! Starts at Silver’s $199/month.)
Data analytics plays an instrumental role at every step of building a successful product. Whether you’re building your user base or releasing a new feature, the right no-code analyticsplatform can help you make evidence-based decisions. Many of these tools even come with AI capabilities. Let’s get right to it.
In a fast-paced industry like SaaS, leveraging business analytics effectively can be the key to staying competitive and driving product growth. Business analytics offers invaluable insights that help SaaS companies optimize operations, enhance customer experiences, and make data-driven decisions.
If you are a SaaS company, the chances are you’ve come across the term “self-serve analytics” at some point online. Unlike traditional data analysis methods, self-serve analytics equips everyone in your organization to explore data and take the right actions in real time. Choosing a good business intelligence tool.
As you’re researching dashboard reporting tools, you’ve probably noticed how hard it is to find reliable information on the available solutions. To make your life a little bit easier and help you choose the best dashboard analyticstool for your SaaS, we’ve produced a guide of 12 excellent platforms available on the market in 2024.
By analyzing user behavior patterns and uncovering valuable insights, behavior analyticstools enable businesses to design strategies that drive retention and business growth. Discover the cutting-edge of behavioral analyticstools! Behavior analyticstools empower companies to make effective, data-driven decisions.
Tracking cross-platformanalytics is essential for product teams to see a complete view of customer behavior. TL;DR Cross-platformanalytics is the activity of tracking and analyzing user behavior across multiple platforms or devices. What is cross-platformanalytics?
Thanks to the abundance of tools out there, marketing has never been easier. In this article, we examine some tools that can help your SaaS team to drive product growth. We will also consider valuable examples of tools that can inspire your process. The best examples are Userpilot , Hotjar , and Google Analytics.
Omnichannel analytics enable teams to get a 360 view of user behavior at different touchpoints of the customer journey. In particular, it covers: What omnichannel analytics are Why it’s important to track How to implement your omnichannel analytics strategy Omnichannel analyticstools Let’s get right into it!
90% of the world’s data has been created in the past 2 years, and businesses spend more than $180 billion annually on big data analytics. Today, due to the internet, software development companies collect such vast quantities of data that we have coined a new term for it: “big data.” What is big data analytics?
A strong analytics stack is foundational to being able to make sense of it all. Investing in a robust and efficient analytics stack is a necessity for a modern business in order to compete. What Technology Do You Need in Your Stack? What Technology Do You Need in Your Stack? Data Tracking and Collection. Major Players.
When it comes to boosting your product growth, user tracking tools can make your life a lot easier. But how do you know you’re picking the right tools? In this article, we share key insights on user tracking tools based on their use cases, which will hopefully help you make up your mind. Analytics features.
Graphs, charts, maps, and tables are powerful communication tools, helping to make data more accessible. It’s also a very powerful tool for sales, marketing, and for sharing information with stakeholders. Certainly, they’ll be the person with the best tool recommendations! Platforms for Data Visualization 1.
It takes a fair bit of effort and time to keep up with the constant innovation in the product management software space. The tools are constantly evolving and changing their pricing plans, so it may be difficult to ensure that your product team is using the right tools and getting the best value for the money.
If you are wondering how actionable analytics can help you boost product growth in 2023, this post is for you! In this article, we cover everything about different types of actionable analytics, how to collect those actionable insights and the best tools you can use to harness the analytical data. Let’s get started.
Reveal Embedded Analytics. Among all embedded analytics products on the market, Tableau is certainly one of the most popular BI tools for analyzing, visualizing, and working with data. Tableau has been helping businesses to transform raw data into valuable insights for more than 16 years. Why choose Reveal? .
We also explore: Different types of product analysis The steps needed to analyze your product The tools you can use Let’s get right to it! To carry out product analysis, you can use the data warehouse and BI tool combo. However, a product analyticstool will usually be cheaper and easier to implement and use.
Experts predict the Customer Analytics market will top $24 billion by 2025. That’s where Customer Analytics comes in. Focused on democratizing access to data-driven decision making, Customer Analyticstools empower non-technical users (like marketing and product teams) to make sense of all the data. Common features.
In 2019, industry-leading Business Intelligence tools (BI tools), Looker and Tableau, were acquired by Google and Salesforce for over $18 billion combined. These massive deals show that BI tools and data warehouses are a powerful combo that companies across the globe are incorporating into their tech stacks.
In SaaS, the top data analytics trends can either be a revolution or just fluff. So what are the trends in the data analytics landscape that are actually important for product management ? Plus, analytics allows companies to unlock new growth opportunities, enhance user satisfaction , and ultimately, increase revenue.
We will be using Airbyte (an open-source data integration platform) and Tableau (a business intelligence and analyticssoftware) for this tutorial. Once you are in, you need to click on the Develop dropdown and then click on Build App. You will be presented with a modal to enter the app name; type in airbyte-zoom.
Reveal Embedded Analytics. Choosing the right embedded analyticsplatform for your business needs is paramount. Table of contents: What are embedded analyticsplatforms? Embedded analytics benefits Top 7 embedded analyticsplatforms Reveal Looker Toucan Sisense Logi analyticsTableau Power BI.
Key features of a modern agile analyticsplatform; how to truly democratize data and help biz users to create analytics at the “speed of thought” Hint: No IT-dependent centralized data-swamps No one in their right mind would think of filling out an IT ticket with requirements to make an Excel spreadsheet, right? probably worse.
We organize all of the trending information in your field so you don't have to. Join 96,000+ users and stay up to date on the latest articles your peers are reading.
You know about us, now we want to get to know you!
Let's personalize your content
Let's get even more personalized
We recognize your account from another site in our network, please click 'Send Email' below to continue with verifying your account and setting a password.


Let's personalize your content