Remove data-analytics-charts
article thumbnail

10 Analytics Dashboard Examples to Gain Data Insights for SaaS [+Best Tools]

Userpilot

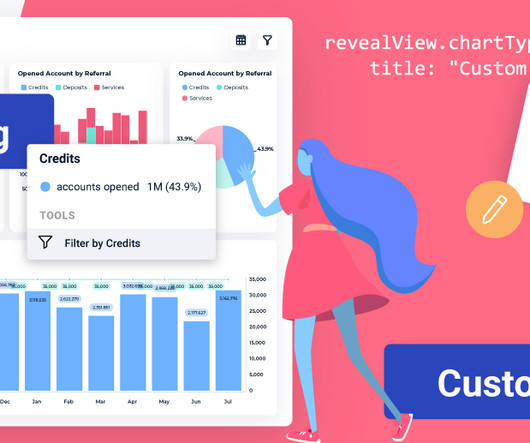
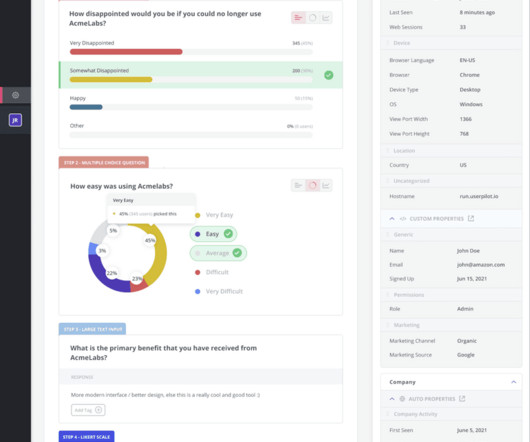
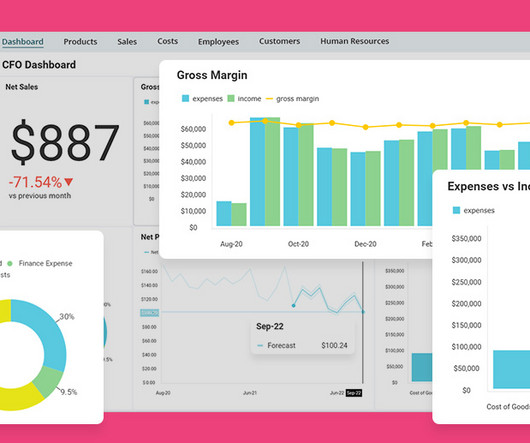
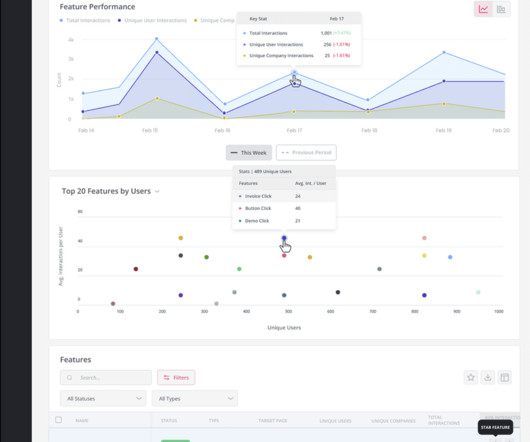
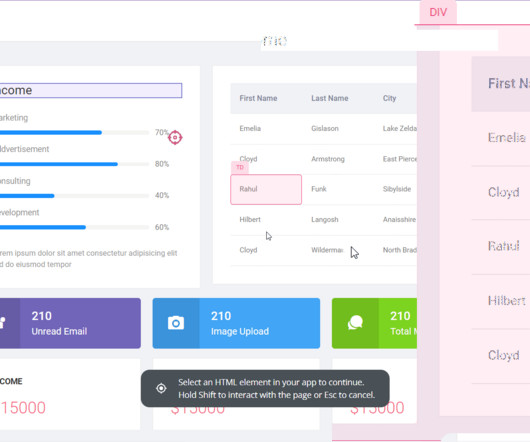
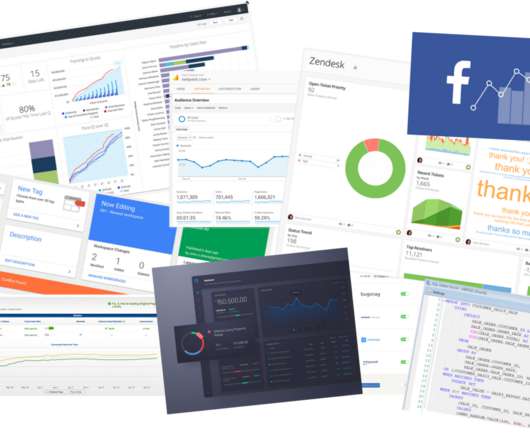
Are you tracking SaaS metrics without knowing how to make the analytics process easier? Analytics dashboards are visualization tools that give you an overview of key metrics. In this article, we’ll discuss 10 analytics dashboard examples. TL;DR Analytics dashboards are tools for visualizing key metrics in your business.

article thumbnail

Reveal 1.6.0 Features Are Here!!

Reveal

Reveal Embedded Analytics Welcome to Reveal 1.6.0! This release brings a host of enhancements, bug fixes, and exciting new features that will refine the way you interact with your data. Tailor the experience for your users by removing any of our default chart types that may not be relevant to your specific needs.

Insiders

Sign Up for our Newsletter

This site is protected by reCAPTCHA and the Google Privacy Policy and Terms of Service apply.

article thumbnail

Marketing Funnel Analysis: Step-By-Step Guide (+Best Tools)

Userpilot

And how to do it with available product analytics solutions? To conduct funnel analysis in tools like Userpilot , Mixpanel, or Google Analytics , define the conversion events for the stage as well as conversion criteria. Want to learn more about funnel analytics in Userpilot? What is marketing funnel analysis? Book the demo!

article thumbnail

Create Effective Dashboard Templates with Ease

Reveal

Reveal Embedded Analytics If you’ve ever struggled to create new dashboards with similar KPIs, integrations, and layouts but different data sources, this article is for you. Dashboard templates are pre-designed layouts that provide a framework for organizing and presenting data in a visual format. It’s Your Turn!

article thumbnail

Funnel Charts for SaaS: The Complete Guide

Userpilot

What are funnel charts and how to use them to gain insights into user progress along their journeys? We also look at situations when funnel charts are most suitable, their limitations, and alternative ways of visualizing data. A funnel chart helps you to track how many users have reached the activation stage.

article thumbnail

5 Funnel Analysis Examples For SaaS Companies (+ Process & Tools)

Userpilot

Create data-driven product roadmaps. Visualize the journey with a funnel analysis chart. Google Analytics – Best tool for tracking website conversion funnels. Create data-driven product roadmaps : Funnel analysis uncovers areas where users struggle the most. Identify friction areas. Increase revenue growth.

article thumbnail

14 User Behavior Trends For SaaS in 2024

Userpilot

Product analytics can help you track changing user behavior for your app but here are some industry-wide changes that are influencing purchasing decisions in 2024. Predictive analytics are driving business decisions such as product and marketing strategy. Funnel analysis chart in Userpilot. Trend analysis chart in Userpilot.