This site uses cookies to improve your experience. To help us insure we adhere to various privacy regulations, please select your country/region of residence. If you do not select a country, we will assume you are from the United States. Select your Cookie Settings or view our Privacy Policy and Terms of Use.
Cookie Settings
Cookies and similar technologies are used on this website for proper function of the website, for tracking performance analytics and for marketing purposes. We and some of our third-party providers may use cookie data for various purposes. Please review the cookie settings below and choose your preference.
Used for the proper function of the website
Used for monitoring website traffic and interactions
Cookie Settings
Cookies and similar technologies are used on this website for proper function of the website, for tracking performance analytics and for marketing purposes. We and some of our third-party providers may use cookie data for various purposes. Please review the cookie settings below and choose your preference.
Strictly Necessary: Used for the proper function of the website
Performance/Analytics: Used for monitoring website traffic and interactions
Choose UX research tools with essential features , collaboration, reliable support , user-friendliness, scalability , integrations , and strong security. Userpilot enhances userexperience through in-depth UX research, offering features to gather, analyze, and act on customer feedback.
Mobile app tracking captures data on how users interact with your app, including actions such as screen views, button taps, session length, and feature usage. For example, say a user opens your app, skips the onboarding tutorial , and heads straight to the dashboard. Only to lose interest and leave without using any key feature.
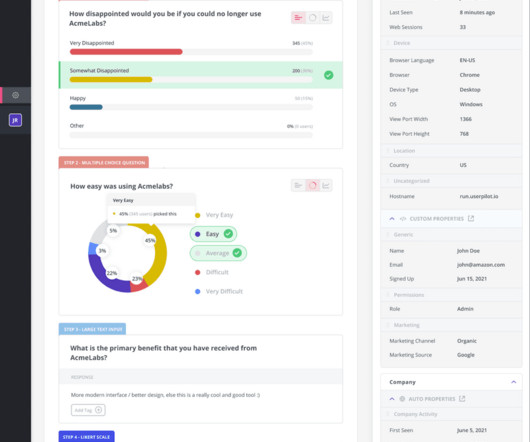
Usability testing: Observe users as they interact with your product to identify usability issues and collect feedback on userexperience. E.g., Identify navigation issues in your analytics dashboard based on real-time user interactions. Survey results dashboard in SurveyMonkey. Dashboard example in Hotjar.
Consider industry certifications like Certified Scrum Product Owner (CSPO) or Certified Associate in Product Management (CAPM) to upskill yourself. Gain exposure and hands-on experience through junior roles in software development. Track key product metrics with analytics dashboards.
TL;DR Choose a product management platform with advanced features, a user-friendly interface, customization, third-party integrations, scalable pricing, robust security , and collaboration features. Userpilot is a top product management software that enhances userexperiences by effectively monitoring user behavior.
They don’t just crunch numbers; they translate their findings into clear and compelling stories through reports, dashboards, and presentations. BI Analyst (3-5 Years) : You’ll take on more responsibility for independent data analysis, report creation, and dashboard development.
A few of the major features to look out for in customer insight platforms are user surveys, behavior analytics , segmentation , and data visualization. Userpilot offers in-app surveys , user action tracking, and behavior analysis to provide granular insights and improve userexperience and product development.
Regularly collect and act on customer feedback to improve the userexperience. Create a customer retention analytics dashboard to measure success across key metrics. Personalized onboarding experiences focus on specific user needs and introduce only features and information relevant to their use cases. The result?
A step-by-step digital onboarding process in banking : Select customer onboarding software with engagement features, analytics, automation, integrations , and compliance certifications. Welcome new customers and use surveys to gather profiling information to personalize their experience. Event analytics dashboard in Userpilot.
Prototyping and design: Wireframes, mockups, userexperience flows. A global retailer engaged an external partner for endtoend development of a mobile loyalty app, including integration with POS systems, analytics dashboards, and thirdparty loyalty providers. Development: Frontend, backend, API integration, agile sprints.
A session replay is a reproduction of a usersexperience on your website or app. For instance, it can serve as a co-browsing tool that allows your support agents to see what users are complaining about and deliver immediate solutions. Playlists: Organize sessions by workflows or user journeys for easy access.
Understanding how customers engage with your product helps tailor their experience, improve satisfaction , and reduce churn, which leads to sustainable growth. 15 creative customer engagement ideas: Personalize the customer experience by tailoring onboarding flows, dashboards, and messaging to specific user personas.
TL;DR Product analytics is the process of collecting and analyzing data about product usage and user behavior. Product analytics tools empower teams to make informed decisions on how to add more value and offer a better userexperience. Pendo Dashboard. How can a product analytics tool help you drive product growth?
He is now the founder and CEO of SecureG , a cybersecurity company providing next-generation, certificate-based security for critical infrastructure. In the past five years, several startups have focused on speed and creating a “magic elixir dashboard” that will solve all their problems.
Both Pendo and Heap support funnel analysis which allows product managers to identify friction points and optimize the product to help usersexperience value in less time. Dashboard in Heap. You can also use it to gather user feedback and design in-app onboarding experiences for both web and mobile products.
The recommended certifications for developing professional skills and improving hiring chances are Google Analytics Individual Qualification, Tableau Desktop Specialist, and Microsoft Certified: Data Analyst Associate. You’ll have to use graphs, charts, and other visuals to present data in an easy-to-understand format.
When you install Google Analytics on your website, you gain access to a basic data-dashboard in exchange for sharing insights with Google. Indicative built its product with the philosophy that its userexperience should be simple and not require technical capabilities, such as writing SQL queries. Website Usage Analytics.
It might also involve working more closely with your designers to make sure the userexperience is designed in a way that will delight customers, as well as being functional, if your goal is to foster a loyal customer base who repeatedly choose you over competitors. Check out our certifications here. Looking for a good read?
It’s like having an unforgeable digital certificate of authenticity. Owning an NFT means you have a digital certificate of authenticity for your precious digital asset. Database Management : Efficient database management is crucial for storing user data, transaction history, and NFT metadata.
Challenges: Legacy infrastructure Technical resources needed for implementation Constantly changing analytics needs Existence of internal analytics tools Building user adoption & getting users to overcome their fear of data Bad data visualization and dashboard design practices The build vs buy dilemma Justifying the cost.
Similar to Tableau, it lets you create interactive, real-time visualizations, with custom dashboards that are easy to navigate. If you’re willing to learn, you can use Dash Open Source to play around with a huge library of components and dashboards. Check out our certifications here. Just plug in your data and go !
Hopstack’s differentiator is its exceptional userexperience. The platform allows users to customize their dashboard UI by adding/removing elements, depending on the project they’re working on. Users have complete control over their interface, which makes ClickUp the preferred tool of many.
“I like … having a great toolkit available to perform the job in hand of developing a seamless and enjoyable userexperience. Native dashboard analytics and reporting. This user was, however, dissatisfied, especially with Docebo’s pricing. Tight exam security that ensures users don’t cheat the system.
Furthermore, legacy systems become slower and slower over time, which means that the users that are forced to use them become more inefficient in their work and their performance and productivity suffers. Reveal’s flexible architecture and rich APIs give you control of the feature in your app making it a seamless part of the userexperience.
Product management certificates are not likely to give you an advantage and may highlight a lack of experience. The most common mistakes in product manager resumes include not focusing on achievements, not using the PM jargon, not presenting the PM skills, and prioritizing qualifications over experience. The short answer is no.
WalkMe for employee experience: feature overview As an employee onboarding platform, WalkMe is used for retraining existing employees when implementing new software solutions and onboarding new staff. The relevant features include: Management dashboards. Analytics to track engagement with the product features and digital experiences.
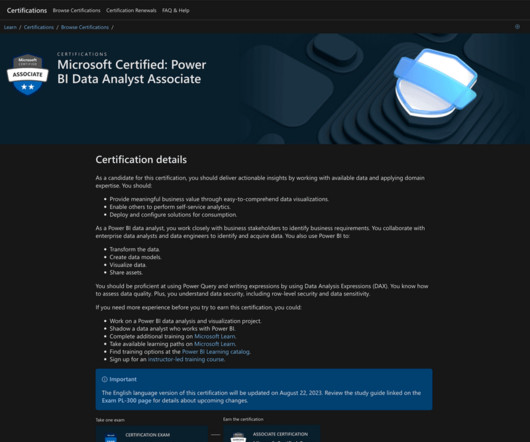
To excel, leverage resources like books (e.g., “Data Analytics Made Accessible”), webinars (Userpilot, BrightTALK), blogs (Userpilot Blog, Mode Analytics), podcasts (The Data Chief Podcast), and certifications (Certified Analytics Professional (CAP), Microsoft Certified: Power BI Data Analyst Associate).
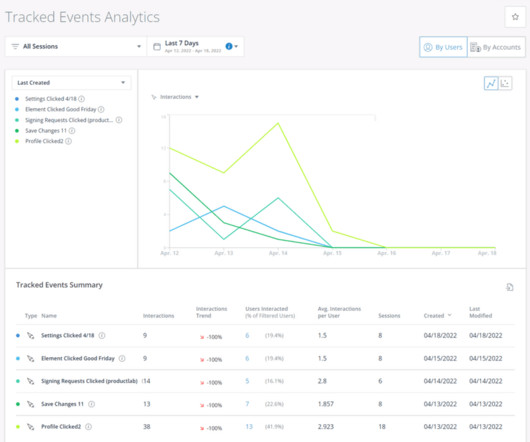
Analyze user interactions with your product to identify the most valuable features. And find ways to optimize the userexperience. Monitor social media, forums, and review pages for user comments. Create a public roadmap where users can submit feature requests , vote them down or up, and follow their development progress.
Data visualization : Create clear and impactful visualizations ( charts , graphs, dashboards ) to communicate data findings effectively to both technical and non-technical stakeholders. Responsibilities include creating reports, dashboards, and visualizations to support decision-making.
They collaborate with cross-functional teams to ensure designs align with business goals and user needs, focusing on optimizing the userexperience and staying current with design trends and technologies. Interested in enhancing user onboarding and engagement? Book a demo today! What does a product design manager do?
Business intelligence analysts have a wide range of tools at their disposal to gather insights and drive decision-making: Userpilot focuses on understanding user behavior within products, while Tableau and Power BI excel in data visualization and dashboard creation, etc. Looking into tools for business intelligence analysts?
A customer advocate focuses on understanding user challenges, gathering feedback , and collaborating with internal teams to enhance the userexperience. Essential tools for customer advocates include Userpilot for user onboarding and feedback collection, Zendesk for CX management, and Asana for project management.
To excel, leverage resources like books (e.g., “Python for Data Analysis”), webinars (Data Science Salon, BrightTALK), blogs (Data Science Central, KD Nuggets), podcasts (Lex Fridman Podcast, Data Skeptic), and certifications (Senior Data Scientist (SDS), Microsoft Certified: Azure Data Scientist Associate, etc.).
SSL Certificates: A dashboard showing the state of SSL certificates across your ADC instances. There are two dashboards available with Performance Analytics, UserExperience, and Infrastructure. You can view the experience indicators over 2 hours, 1 day, 1 week, etc.
In SaaS, they focus on optimizing userexperience, onboarding processes, and feature usage. Customer experience analyst’s main responsibilities Customer experience analysts play a vital role in ensuring a company’s customers are satisfied and engaged. Available on major podcast platforms.
Data visualization : Create clear and impactful visualizations ( charts , graphs, dashboards ) to communicate data findings effectively to both technical and non-technical stakeholders. Responsibilities include creating reports, dashboards, and visualizations to support decision-making.
Pursue internships or entry-level positions in design to gain practical experience and build a robust portfolio. Focus on developing strong skills in userexperience (UX) and user interface (UI) design, utilizing design tools like Sketch, Figma, and Adobe Creative Suite.
Best tools for growth product managers Best tool for data analytics and visualization – Userpilot : Enables you to track in-app user behavior across multiple touchpoints and perform comprehensive analytics, utilizing custom dashboards and charts for easy visualization. It teaches how to leverage product strategy for user growth.
This helps personalize the userexperience and target marketing efforts effectively. This might involve creating reports, dashboards, and presentations to communicate complex insights effectively. This helps optimize the product for better userexperience and conversion rates. new features, pricing models).
The same applies to gamifying user onboarding and product adoption. FourSquare is a product example that utilized rewards and rivalry to gamify its userexperience and nudge the users to use the app more often. The company exploded in 2009 around the premise of rewarding users points for each new place they visited.
3 – Typeform Although Typeform is a general survey software like SurveyMonkey, it has a unique approach to userexperience with an interactive interface that allows you to incorporate images, GIFs, and videos—turning mundane questionnaires into interactive storytelling experiences. Alchemer dashboard.
Certifications in customer experience, data analytics, business analysis, and project management can also boost your expertise. A few to consider include Google Data Analytics Professional Certificate, Certified Business Analysis Professional (CBAP) Certification, etc.
In the same vein, celebrate successes and milestones with UI elements such as certificates, badges, and happy characters. Collect customer feedback and monitor user satisfaction metrics , such as the customer effort score and NPS to keep an eye on where things stand. Provide contextual in-app guidance and help usersexperience value.
“Inspired: How to Create Products Customers Love” by Marty Cagan : Marty Cagan discusses the intersection of technology, business, and userexperience, offering a deep dive into how product managers can align these elements to enhance product operations.
We organize all of the trending information in your field so you don't have to. Join 96,000+ users and stay up to date on the latest articles your peers are reading.
You know about us, now we want to get to know you!
Let's personalize your content
Let's get even more personalized
We recognize your account from another site in our network, please click 'Send Email' below to continue with verifying your account and setting a password.


Let's personalize your content