This site uses cookies to improve your experience. To help us insure we adhere to various privacy regulations, please select your country/region of residence. If you do not select a country, we will assume you are from the United States. Select your Cookie Settings or view our Privacy Policy and Terms of Use.
Cookie Settings
Cookies and similar technologies are used on this website for proper function of the website, for tracking performance analytics and for marketing purposes. We and some of our third-party providers may use cookie data for various purposes. Please review the cookie settings below and choose your preference.
Used for the proper function of the website
Used for monitoring website traffic and interactions
Cookie Settings
Cookies and similar technologies are used on this website for proper function of the website, for tracking performance analytics and for marketing purposes. We and some of our third-party providers may use cookie data for various purposes. Please review the cookie settings below and choose your preference.
Strictly Necessary: Used for the proper function of the website
Performance/Analytics: Used for monitoring website traffic and interactions
Without effective UXanalytics that goes beyond collecting data, you’re losing valuable customers. Unfortunately, the research backs this up, with a staggering 90% of usersreporting that they stopped using an app due to poor performance. It covers key topics, such as: Defining UXanalytics.
Let’s review everything your customer success team has to do in the absence of any customer success tools. Collect customerdata to calculate complex formulas for tracking metrics, monitor customer health scores, and resolve support tickets while continuously trying to improve retention and expansion.
Most product teams get mobile app analytics wrong. They track 47 different key performance indicators (KPIs) in their mobile analytics platform , spend hours debating dashboard numbers, yet can’t predict which users will churn next week The problem here isn’t a lack of data.
But heres the twist most folks misswhat separates those who simply have a funnel from those who crush their revenue goals is their obsession with thoughtful UX design at every single touchpoint. And Im not talking about pretty visuals for the sake of it. The secret often lies in the art of User Experience design.
Drawing from his 20+ years of technology experience and extensive research, Nishant shared insights about how these activities vary across different organizational contexts – from startups to enterprises, B2B to B2C, and Agile to Waterfall environments.
You see, although we work hard to make Userpilot the best product adoption tool on the market, we know it isnt the perfect fit for every business. You get something that truly works for you, and we get to connect with people who value what we offer and have the potential to become power users (and sources of sustainable revenue!).
If there is one thing thats altering the way we create user experience (UX) designs and conduct research in 2024, it is definitely artificial intelligence (AI). UX experts have already integrated AI into their daily lives in one way or another. From new UX-related technologies and automation to personalization.
What tools do you use? How do you manage all of that data? We’ve compiled a list of the best tools for mobile in-app feedback —from the technical, back-end side to A/B testing to analyzing VOC (voice of customer). In other words, these in-app visualanalytics track touch gestures. Where do you start?
Outcome Level Measures the impact on the customer and business outcome. This level is evident since we all want to design user-centered products that align with businessgoals. User experience: Measure how UX research impacts the user experience. Average time on page in Google Analytics. returning customers).
Why measuring UX in dollars misses the biggerpicture Photo by Jakub erdzicki on Unsplash Is anyone else frustrated when asked to attribute UX to financial metrics? I remember sitting in a leadership meeting as the UX leader, and out of nowhere, someone asked, Jas, whats the Return On Investment, aka ROI, on UX?
You can struggle with one of the following five misconceptions about measuring UX: 1. UX can be measured with a singlemetric How are we doing? NPS survey dashboard in UsrGuiding tool. Also, when you rely on one metric, the risk of data manipulation increases. These will provide more objective insights.
How Companies Are Funding User Research in 2025: Insights from the User Interviews Research Budget ReportUser Interviews 2025 Research Budget Report is a crucial resource for understanding how modern organizations are approaching the financial side of user research. Only 17% experienced reductions.
Through case studies, statistical evidence, and methodological frameworks, I aimed to establish how systematic user research can positively impact key business metrics, from acquisition to referral. This fundamental gap in understanding is where UX Research becomes not only valuable but essential for driving authentic and lastinggrowth.
During the third stage, input is analyzed and during the fourth stage, the insight gained from analysis is used to make decisions. Our objective is to understand customer needs and adjusting. . Get Insights. And per customer? CustomerSatisfaction. Do customers feel like they are being heard?
When users interact more, it may seem like a win. However, without qualitative feedback and behavioral insights, teams risk misreading signals, leading to frustration and churn. Numbers alone can be misleading higher engagement doesnt always mean usersatisfaction. Key differences between data types.
Similarly, service designers are trained to navigate through complex systems of an environment/ situation by leveraging their system thinking capabilities. For instance, in the case of pension services, there might be financial advisors, pension administrators, and customerservice agents involved.
The choice is tough because there’s no single tool that covers all use cases. What’s worse, you will find multiple tools in each category, making it incredibly difficult to pick the tool that satisfies your needs and offers the best value for money. Which product feedback software should you choose for your SaaS?
Customersatisfactionanalytics are key to understanding what makes your customers happy and building a product that retains users. But how can you leverage this user sentiment data to lead product development and grow your business? There’s no single KPI to measure customersatisfaction.
From Raw Data to Clarity — Cleaning, Sorting, and Synthesising Insights Part 4 (of 5) of the UX Research Playbook series Synthesising qualitative data is similar to reaping the harvest after the diligent effort poured into research — it’s the step where hard work blossoms into meaningful insights. is recommended.
Quantitative data alone doesn’t reveal intent, only outcomes. Thats why you need user session analysis. By combining contextual insights from session replays , heatmaps, and behavior analytics, user session analysis helps you interpret metrics through the lens of real user journeys.
Are you struggling to make sense of scattered userdata? The right customeranalytics platform helps you uncover exactly how customers interact with your product: so you can spot issues early, optimize user journeys, and drive sustainable growth. Pendo – the best software for product-led insights.
User experience analytics is one of the secret ingredients for boosting SaaS growth. By regularly checking your analyticsdata, you will proactively spot issues and find ways to resolve them. This ensures your product remains enjoyable for users, boosting retention and loyalty. across the customer journey.
TL;DR Customer experience software helps you analyze, manage, and improve all facets of your product to boost customersatisfaction. Every customer experience solution focuses on a different aspect of improving customer interactions. Userpilot helps you with customer engagement and data management.
If you are a SaaS company, the chances are you’ve come across the term “self-serve analytics” at some point online. Unlike traditional data analysis methods, self-serve analytics equips everyone in your organization to explore data and take the right actions in real time. Choosing a good business intelligence tool.
Want to understand what customers think and how they behave in your product ? If so, you need to invest in the right customerinsighttools. These tools are perfect for providing valuable customerinsights to make product improvements and optimize your customer experience.
Business Model Canvas (BMC) BMC is a tool used to map out key elements of a business model in a single page. It visualizes how the business operates and creates value. BMC components Customer segments: Different groups of people or organizations that your business aims to serve. Business Model Canvas by Strategyzer.
What happens when you build a product or service around what you think potential customers want, only for them to buy something else? For starters, it shows you dont know your customers well enough. But worse than that, it leads to lower revenue, failed products, and plummeting customer loyalty.
Thats where real user monitoring tools come inthey provide real-time insights into how users engage with the app , helping you detect performance issues before they impact your bottom line. Conversion funnel tracking : Analyzes where users abandon processes like the onboarding flow. Weve done the research for you!
Wondering how to leverage customeranalytics benefits to drive customersatisfaction? Customeranalytics helps you seamlessly understand customers, predict their needs, and curate your offerings to their wants. More personalized experiences for customers with segmentation and customerdata.
Customer intelligence (CI) data and insights are instrumental in product management. They also help create a personalized customer experience and improve product adoption. However, with so many customer intelligence tools available, how do you select the right one? Book a demo now to see it in action.
What is data-driven analytics in SaaS? How to conduct userdata analysis? What are the best analyticstools for the job? By understanding how users behave inside the product and their goals and problems, you can reduce time to value. This improves customersatisfaction and retention.
Looking for customeranalytics use cases that can significantly improve your SaaS? This article lists key use cases for SaaS and explains how to implement them to unlock customersatisfaction and product growth. We also cover: Customeranalytics categories. Increase usersatisfaction.
Poor mobile UX design leads to high bounce rates, abandoned carts , and negative app reviews. How do you turn that around and deliver mobile experiences that keep users returning to your platform ? We covered: What mobile UX design is (and how it differs from desktop UX). What is mobile UX design? Lets dive in!
A customer sentiment dashboard is a great way to visualizecustomer feedback and see what users love (or hate) about your product. But how do you collect the right data for your analysis? This article shows you a step-by-step process and some of the best tools to use. Sentiment distribution.
What are userdataanalytics? From this article, you’re going to find out about different types of userdata analysis and how to develop a userdataanalytics strategy that will help your team make data-driven decisions to enhance customer and product experience.
In today’s competitive landscape, customer experience (CX) stands as a cornerstone of success, particularly in the financial services industry. In our digital world, it has never been easier for customers to switch banks, wealth and investment managers, or financial technologies.
How New Heuristics Are Reshaping the Creative Process Between Humans andMachines Image generated byChatGPT When the wave of generative AI tools began flooding the market, I must confess my reaction was mixed: a sense of fascination for the possibilities and concern for the ethical challenges looming on the horizon.
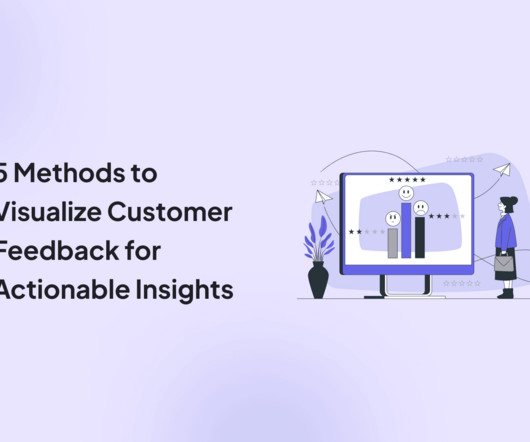
Saving time isn’t the only benefit of visually analyzing customer feedback. Being able to examine customer feedback datavisually also makes it easier to derive actionable insights and, ultimately, form decisions. How do you visualizeuser feedback , and what are the different methods to go about it?
This case study reveals how Rumi Cosmetiques doubled its conversion rates and saw a 75% increase in adds to cart within a week, thanks to strategic changes in their user experience (UX) design and conversion rate optimization (CRO). Continuous Improvement with Analytics Lastly, Rumi wasnt content to rest on their laurels.
How can SaaS companies use self-serviceanalytics to gain the insights they need to drive product growth ? TL;DR Self-serviceanalyticstools enable non-technical product teams to access and analyze customerdata without dev or data scientist support. What is self-serviceanalytics?
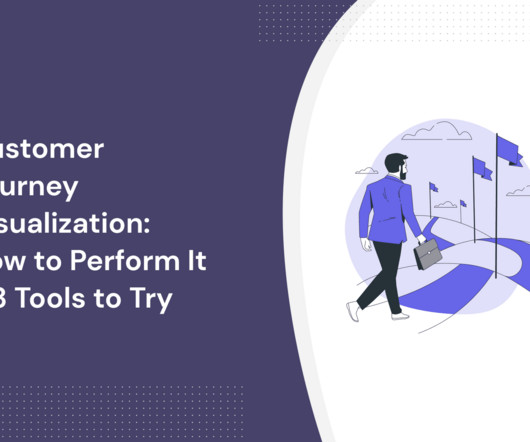
Want to conduct customer journey visualization but not sure what’s the best way to do it? This article shows you a step-by-step process for collecting customerdata and creating easy-to-understand visual maps. TL;DR A customer journey map represents the steps users take when interacting with your brand.
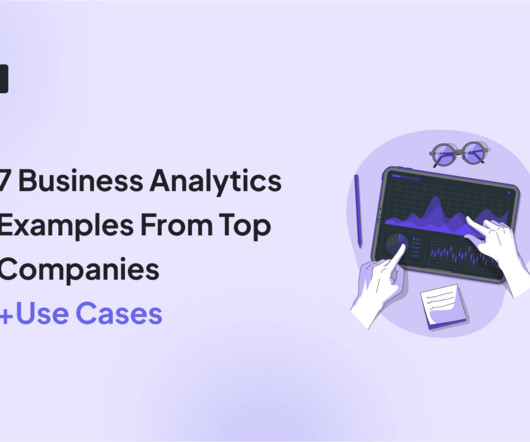
Data-driven companies are 58% more likely to hit revenue goals. This shows how important business analytics is for your product. Business analytics gives insights that help you make better decisions to improve your product. This article will show seven examples of business analytics to highlight its positive impact.
Todays Fintech disruptors and neobanks are igniting our brains reward centers with flashy visuals, gamified challenges and social interactivity that practically beg us to keep coming back for more. It ultimately changes how we think about financial services. Today, clients expect more than a basic straightforward financial service.
Data-Driven Insights: Analyzing user behavior, AI offers insights that guide design decisions. Personalization: AI tailors products to individual preferences, enhancing usersatisfaction. for transcription and insights. Leverage Designify to enhance visuals or create mockups automatically.
We organize all of the trending information in your field so you don't have to. Join 96,000+ users and stay up to date on the latest articles your peers are reading.
You know about us, now we want to get to know you!
Let's personalize your content
Let's get even more personalized
We recognize your account from another site in our network, please click 'Send Email' below to continue with verifying your account and setting a password.


Let's personalize your content