This site uses cookies to improve your experience. To help us insure we adhere to various privacy regulations, please select your country/region of residence. If you do not select a country, we will assume you are from the United States. Select your Cookie Settings or view our Privacy Policy and Terms of Use.
Cookie Settings
Cookies and similar technologies are used on this website for proper function of the website, for tracking performance analytics and for marketing purposes. We and some of our third-party providers may use cookie data for various purposes. Please review the cookie settings below and choose your preference.
Used for the proper function of the website
Used for monitoring website traffic and interactions
Cookie Settings
Cookies and similar technologies are used on this website for proper function of the website, for tracking performance analytics and for marketing purposes. We and some of our third-party providers may use cookie data for various purposes. Please review the cookie settings below and choose your preference.
Strictly Necessary: Used for the proper function of the website
Performance/Analytics: Used for monitoring website traffic and interactions
When your company adopts multiple SaaS solutions to drive productivity, you unknowingly create a perfect storm for data fragmentation. Your customer information lives in Salesforce, while your support tickets are in Zendesk, your product usage data in Mixpanel, and your marketing campaigns in HubSpot. Sound familiar?
Ada and I both had the privilege of working at two data-driven companies, LinkedIn and SurveyMonkey , led by two analytically rigorous leaders, Jeff Weiner , and the late Dave Goldberg. Those experiences shaped the way that we both now think about building an effective data-driven product culture. Why metrics reviews matter.
Case Study: Improving Data-Driven Decision Making for CSR Leadership Civian is a data-driven platform designed to help businesses measure, optimize, and showcase the social and economic impact of their investments in communities. Feature Engagement Users most frequently gravitated toward the map to explore and compare data.
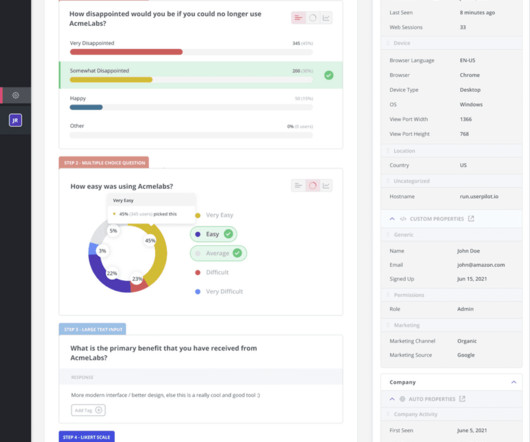
In the retail industry, customer feedback is your early warning system, your innovation engine, and your most honest performance review. But this system only works if you take action on the feedback collected. Turn survey responses, reviewdata, and post-purchase feedback into clear dashboards your teams can actually use.
In one of the keynotes of this year’s MTP Engage Hamburg, Johanna Kollmann reviews established system thinking concepts and applies them to the world of today’s product management. Practical Ways of Understanding Systems. As soon as a system is understood, we can try to change or improve it. Systematic Improvement.
In this Whatfix Mobile review, youll find answers to three questions: What does Whatfix Mobile offer? Whatfix delivers context-aware guidance that helps users correctly complete sensitive tasks like handling patient documents, uploading payroll data, etc., Whatfix G2 review. Is it the right fit for you? Whatfix mobile pricing.
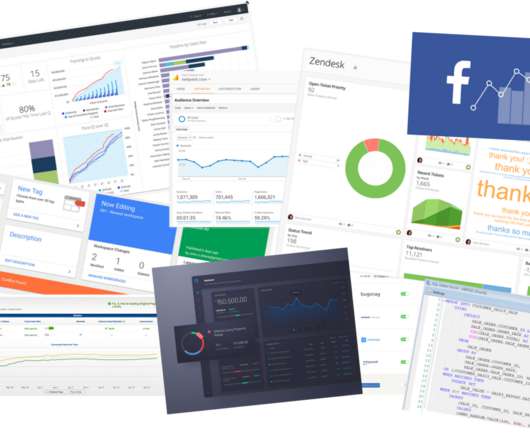
Reveal Embedded Analytics We know how difficult it is to create dashboards, especially for web applications. Thats what dashboards are for. They track everything from user behavior to system performance. In fact, Angular dashboards can provide key insights that will eventually allow data-driven decision-making at your company.
Let’s review everything your customer success team has to do in the absence of any customer success tools. Collect customer data to calculate complex formulas for tracking metrics, monitor customer health scores, and resolve support tickets while continuously trying to improve retention and expansion.
Often, this is due to resource constraints rather than a lack of understanding of a PM role. Data PM: organizations dealing in data products (building AI/ML based products) prefer a PM with data science background so that they can appreciate the problems well and being able to work with data engineers/scientists.
IDEs) that help you write code with the help of AI Let’s review the most popular tools in each category to see what they can do and what we can build. Claude goes one step beyond ChatGPT’s abilities with their Artifact system. file conversion, job applicant tracking) and data-driven applications (e.g.
Last month we turned our attention to data – unleashing new features that help you improve how you collect, access, and use first-party data to influence your product and scale your business. Satmetrix Systems, Inc., and Net Promoter System? Satmetrix Systems, Inc., Learn more about our data hosting program here.
We introduced regular alert review sessions for teams dealing with frequent alerts. Each alert review session starts with an ordered list of alerts that fired in the previous period, ordered by frequency of their firing. fire most frequently) are reviewed first. . 8 questions to ask when assessing your team’s alerts.
Justin Norris After reviewing his post, I feel that Justin highlights the following key activities in order to produce valuable report designs: Help stakeholders communicate their ideas. Perform a report and/or data feasibility analysis. Identify the metrics i.e. the quantitative measurements of data. Build a mockup [prototype].
When one tool gathers feedback via email and another through your website, consolidating all that data and customer feedback can be nearly impossible. Most organizations struggle with disconnected tools that create data silos and incomplete customer insights. You can connect Alchemer to just about any other system without hassle.
This is where self-hosted systems often fail. In just a few clicks, you combine properties and events to craft ultra-specific segments and deploy targeted campaigns directly from the Userpilot dashboard. Use user data (name, location, preferences, past behaviors) to send relevant, personalized notifications. Then go deeper.
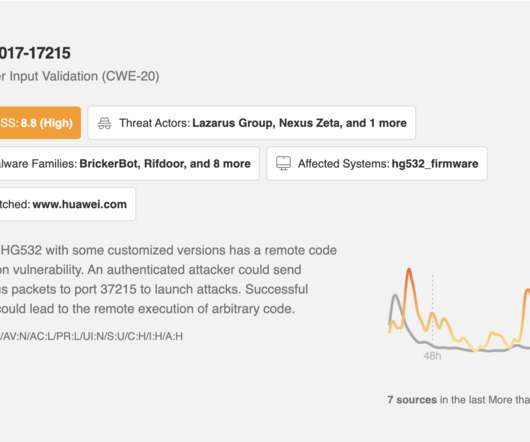
The consequences of missing critical information are astronomical, but no human can keep up with this onslaught of data on their own. All of this information is available at a glance via the Leo CVE Dashboard and throughout your Feeds. The Leo CVE Dashboard: a complete CVE overview in a glimpse. Try Feedly for Cybersecurity.
Reference values CRR varies widely across industries due to differences in customer expectations about business. How to collect data forCRR The most reliable source for collecting data for CRR is your Customer Relationship Management (CRM) system. New customers acquired: Number of customers gained during theperiod.
Users share sensitive data and entrust performing operations with their finances, so even minor defects in fintech products destroy confidence, make users question the company’s expertise, and what’s worse, abandon an app. Fintech software represents specific challenges due to diverse dynamic content, graphs, tables, and more.
It underpins a whole host of core Intercom features – Inbox Views , API , Articles , the user list, Reporting , Resolution Bot , and our internal logging systems. “How do you take a data- and infrastructure-heavy service like Elasticsearch and build automation around it that makes all that heavy maintenance as invisible as possible?”
Sprout Social has an in-depth guide to demographic data from the most popular social networks of 2020. To make your job a little easier, we’ve curated a list of resources to the submission processes of the three most popular app stores: Apple App Store Review Guidelines. Common Reasons for Apple App Store Rejections.
They track 47 different key performance indicators (KPIs) in their mobile analytics platform , spend hours debating dashboard numbers, yet can’t predict which users will churn next week The problem here isn’t a lack of data. Teams are drowning in the wrong usage metrics while missing important behavioral data signals.
Generating data is easy. Data is often not accessible unless you can write code. People in non-technical roles rely on data every day to make decisions, develop ideas or measure success. When tools and systems are not created with them in mind, they lose trust and understanding. for sharing information. Meet Francesca.
mParticle is the customer data platform for brands leading the CX revolution. Unify data and simplify partner integrations with enterprise-class security and reliability. It provides the speed and efficiency mobile apps require for constantly changing products while maintaining the security and integrity of existing systems.
Imagine this: Your IT team has invested in cutting-edge observability tools to keep systems running smoothly. While observability is essential for identifying performance bottlenecks and ensuring reliability, unchecked data collection and storage costs can make it a financial burden rather than an enabler.
mParticle is the customer data platform for brands leading the CX revolution. Unify data and simplify partner integrations with enterprise-class security and reliability. It provides the speed and efficiency mobile apps require for constantly changing products while maintaining the security and integrity of existing systems.
A self-service data platform is the backbone of informed decision-making and a growing SaaS business. But how do you choose the right data platform for product analytics ? Let’s go over what a data platform is, its importance, and the must-have features you should consider to choose the right platform for you.
NPS survey dashboard in UsrGuiding tool. In reality, UX is multidimensional, and it requires multiple qualitative and quantitative metrics like task success rate, user satisfaction score, and summary of user reviews. Also, when you rely on one metric, the risk of data manipulation increases. NPS alone doesnt cover theseareas.
According to Harvard Business Review, 80% of new products fail, primarily because companies fail to conduct proper customer research. It could include conducting user interviews and surveys, analyzing product usage data, and tracking customer feedback , to name a few. For starters, it shows you dont know your customers well enough.
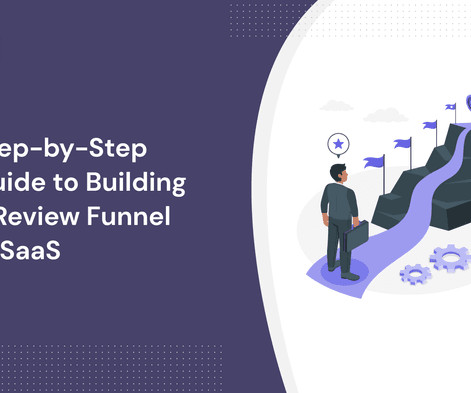
A review funnel is essential for every business, including your SaaS company. Customers trust real customer reviews just as much as recommendations from friends and family. Building an effective review funnel that converts is pretty straightforward, but brands can get lost on its value. What is a review funnel?
Because of how complex product management can be, it’s not hard to see why effective data sharing can be difficult to achieve throughout an entire organization. These obstacles result in data silos that lead to different departments having conflicting data and struggle to access data quickly. What are data silos?
For example, here is a video from 2016 that showcases the vision for SpaceX's Interplanetary Transport System which aims to bring the first manned crew to Mars. Inevitably I still re-create the high-level roadmap in presentations for All Hands meetings, exec reviews, and sometimes even customers. Execution: Metrics Dashboards.
On top of that, Userpilot also offers in-app engagement tools you can use to act on the collected data. Autocapture events dashboard in Userpilot. Custom dashboards: Custom dashboards help you gather crucial metricslike average session duration, recurring revenue, or funnel conversions all in one place.
How to create customer feedback systems to gain insights into user needs ? TL;DR Customer feedback systems are frameworks for collecting, organizing, and analyzing customer feedback for actionable insights. For example, you can improve user experience with in-app guidance , enhance the customer support system, or release new features.
That’s exactly what we explore in our review. Retroactive analytics Retroactive analytics enables non-technical product teams to track user behavior data without any coding. With Pendo, you can collect retention data and present it in interactive charts. Visitor and account data, like demographic data.
What is a data product roadmap? TL;DR A data product roadmap is a product development strategy where the product manager and their team use insights from various data sources to inform decisions. The difference between a data product roadmap and the traditional approach is the former relies heavily on data.
You can review Pendo's analytics in their free trial, which displays various different graphs on the basis of dummy data. To replace the dummy data with real numbers from your SaaS company, you'll need to install a JS snippet. Compared to Pendo's other analytics features, this feels like vanity data.
The research process for even small purchases can be long and difficult: there are reviews to read, content to consume, docs to check, and questions to be asked. With live chat software , you can use website traffic data or what you already know about your products to decide where your support is most useful.
Obviously we’re biased (though I would point you to the reviews on G2 Crowd to show that we’re not that biased) but Intercom is the backbone of our entire marketing stack. Intercom’s power comes in tracking and monitoring customer data so we can better understand our audience and properly serve them with the right content and messages.
WalkMe analytics dashboard. Customer behavior analytics When it comes to customer data analytics, WalkMe offers: User journey analytics : You can conduct funnel and path analysis to see how users progress from one stage to another and identify friction points leading to drop-offs and increasing time to convert. Custom dashboards.
The most immediate change that took place due to the pandemic was the increased volume of customer or sales queries,” says Austin Guanzon, Overseas Manager and Product Specialist at Dialpad. “As But even when you have the raw data, you need to be able to leverage it in the right way in order to actually make a difference.
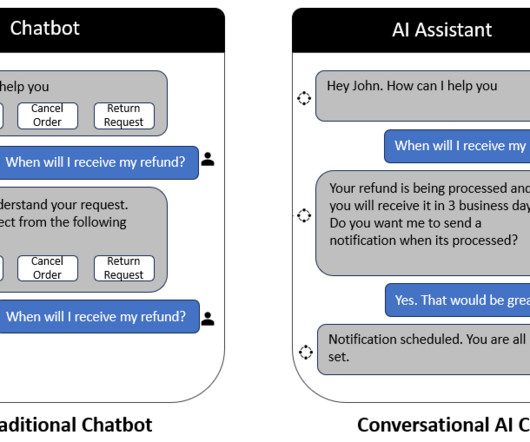
It’s like chatting with a friend, but you’re communicating with a program or system that understands and responds to what you’re saying in a human-like way. They engage in free-flowing conversations, fueled by a Large Language Model that serves as a bridge between users and backend systems, ensuring a seamless user experience.
Poor mobile UX design leads to high bounce rates, abandoned carts , and negative app reviews. Gather user data through surveys, interviews, and behavioral data from tools like Userpilot. For example, if the goal is to create a new task, dont also ask the user to assign teammates, add labels, and set due dates on the same screen.
Uptime: How long or how reliably a system has been running. Data loss rate: The intentional or unintentional loss of data caused by forces within or outside an organization. This could happen through normal processes like data migration or through malicious attacks. . Outcome metrics. Actually track its usage (meta!).
And the behavioral data you do collect depends on what you choose to track and how you track it. Open up a webpage, drop in a script, and boom: clicks, scrolls, and form inputs start flowing into your dashboard without writing a single line of code. And if they reinstall the app, you lose whatever local data you had.
We organize all of the trending information in your field so you don't have to. Join 96,000+ users and stay up to date on the latest articles your peers are reading.
You know about us, now we want to get to know you!
Let's personalize your content
Let's get even more personalized
We recognize your account from another site in our network, please click 'Send Email' below to continue with verifying your account and setting a password.


Let's personalize your content