This site uses cookies to improve your experience. To help us insure we adhere to various privacy regulations, please select your country/region of residence. If you do not select a country, we will assume you are from the United States. Select your Cookie Settings or view our Privacy Policy and Terms of Use.
Cookie Settings
Cookies and similar technologies are used on this website for proper function of the website, for tracking performance analytics and for marketing purposes. We and some of our third-party providers may use cookie data for various purposes. Please review the cookie settings below and choose your preference.
Used for the proper function of the website
Used for monitoring website traffic and interactions
Cookie Settings
Cookies and similar technologies are used on this website for proper function of the website, for tracking performance analytics and for marketing purposes. We and some of our third-party providers may use cookie data for various purposes. Please review the cookie settings below and choose your preference.
Strictly Necessary: Used for the proper function of the website
Performance/Analytics: Used for monitoring website traffic and interactions
How Rumi Cosmetiques Boosted UserExperience and Conversion Rates in eCommerce: A Case Study for Marketers andManagers Discover how Rumi Cosmetiques achieved a 75% increase in cart adds and doubled conversion rates by enhancing userexperience and conversion rate in eCommerce.
Reveal Embedded Analytics We know how difficult it is to create dashboards, especially for web applications. Thats what dashboards are for. They track everything from user behavior to system performance. In fact, Angular dashboards can provide key insights that will eventually allow data-driven decision-making at your company.
These small wins create momentum, helping users build healthy financial habits overtime. The problem is that users unconsciously develop everyday financial behaviors and decision-making patterns that can collide with cognitive biases, like loss aversion and mental accounting. In fact, sometimes less really is more.
For example, you could: Equip ICU teams with step-by-step walkthroughs so nurses can confidently use life-support dashboards in under ten minutes. Create tailored user journeys based on specific conditions. After isolating the root cause, you can use Userpilot to create in-app guides or checklists to offer contextual help.
But today, dashboards and visualizations have become table stakes. Think your customers will pay more for data visualizations in your application? Five years ago they may have. Discover which features will differentiate your application and maximize the ROI of your embedded analytics. Brought to you by Logi Analytics.
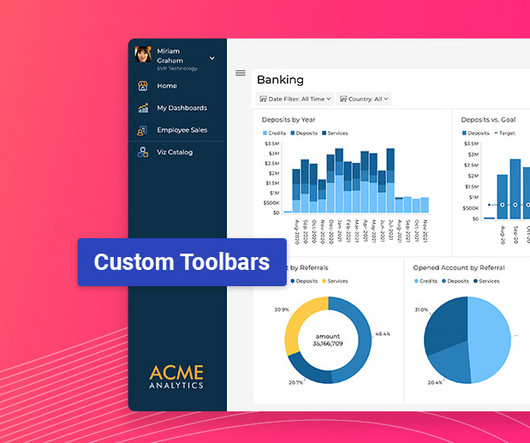
Latest Update Features: Custom Toolbars: Full control over dashboard menus. Developer Controls: Streamlined UI and SQLite support. Custom Toolbar Options: Full Control Over Menus Developers can now fully customize dashboard and visualization toolbars using the revealView.onMenuOpening event handler. visualization title).
Variety of UI patterns to engage users, including modals , tooltips , and slideouts. A/B and multivariate testing for optimizing userexperiences. Custom dashboards to track key metrics at a glance. Analytics reports like paths, funnels, and cohort tables for visualizing user behavior data. UserGuiding dashboard.
Flexible Chart Legend Positioning: Move and align legends for better dashboard design. Date Filter API Update: More structured filtering for developers. Date Filter API Update: More Power for Developers Enhanced API Usability: The onDateFilterMenuOpening event now utilizes IRVDateFilterMenuItem objects for more structured handling.
Unfortunately, the research backs this up, with a staggering 90% of users reporting that they stopped using an app due to poor performance. Basically, anything that ruins the userexperience. UX analytics involves gathering, analyzing, and interpreting data about how users interact with your product or service.
A product analytics strategy is essential for any business looking to make informed decisions about product development and userexperience. Plus, there are many reasons why you need a product analytics strategy: Aligns product development with user needs and business goals. Lack of team resources.
When data collection is messy, product managers lose visibility, teams waste hours chasing answers, and userexperience suffers. Heres how data fragmentation hurts your product strategy and development: Fragmented data can cause flawed strategic decisions Every product decision starts with a question: Whats driving retention ?
When it comes to product management, you need to look at different SaaS dashboard examples to see what kind of product analytics you can measure, and how. So what are the most important types of dashboards and which ones are the best for you? A SaaS (software-as-a-service) dashboard is a centralized interface within your app.
A customer sentiment dashboard is a great way to visualize customer feedback and see what users love (or hate) about your product. TL;DR A sentiment analysis dashboard typically integrates information from multiple data sources, such as social media posts, customer reviews, survey responses , and customer service chats.
Website feedback and online surveys : These collect opinions about digital experiences, focusing on usability and content quality. Businesses can use this feedback to improve website navigation, enhance userexperience, and drive conversions. By actively seeking feedback, businesses can foster customer loyalty.
Get to Know Your User (30 minutes) First things first – who are you solving for? This step is all about understanding who your user is. Example: Imagine you’re designing a new dashboard for a fintech app. ” Perhaps users are spending a lot of time on manual tasks. Big difference, right?
Explore-things-web-development-vs-app-development Are you confused about web development vs app development while creating a digital application? Explore more to define web vs mobile development further. When developing a software application, the important thing is to consider cost efficiency.
Choose UX research tools with essential features , collaboration, reliable support , user-friendliness, scalability , integrations , and strong security. Userpilot enhances userexperience through in-depth UX research, offering features to gather, analyze, and act on customer feedback.
Would you like to learn how to design a SaaS metrics dashboard for your team without any coding? In the article, you will find examples of various SaaS dashboards and learn how to create them with Userpilot analytics. If so, you're in the right place! Let's dive in, shall we? Let's dive in, shall we? To name just a few.
Results : Implementing Userpilot allowed Zoezi to prioritize development efforts based on actual user behavior, leading to better resource allocation. It also improved communication with users, who appreciated the in-app release notes and updates. . Deliver release notes via modals (and track user engagement).
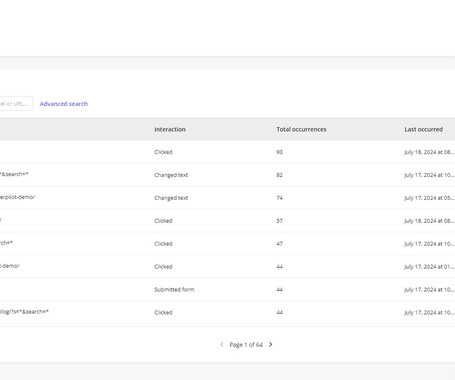
Userpilot’s Visual Labeler enables you to track in-app user behavior, such as clicks, text input, and form submissions, code-free and with no interference from your dev team. With the product usage dashboard, you can track user engagement metrics, popular pages and features, top interactions, trends, and even browser preferences.
The solution might lie in your ability to create a comprehensive userexperience map. A well-crafted userexperience map can be your secret weapon for understanding customers, identifying pain points, and boosting product engagement. We also identify some best practices to follow when creating the userexperience map.
The product development life cycle is an exciting and complex process. This article will break down the stages of a product development life cycle and tools that can help you deliver a great product. TL;DR The product development life cycle is the systematic process of taking a product from an idea to its commercialization.
This powerful tool allows you to see your website or web app through your users’ eyes. It reveals the “why” behind their actions and unlocks valuable insights to improve the userexperience. Conversely, session replays don’t actually record a user’s screen in the traditional sense.
Without a strong and consistent digital brand, financial institutions risk being overshadowed by nimble Fintech startups or tech giants like Apple and Google that excel in userexperience. A strong digital brandensures: Customer Loyalty: A seamless and intuitive digital experience keeps customers engaged. million to 91.7
Much of the literature that defines the role as the intersection of business, technology, and userexperience isn't particularly helpful for practitioners who are left wondering what skills they need to learn versus the fine people they work closely with in actual business, technology, and userexperience roles.
In a fastmoving digital economy, many organizations leverage outsourced software product development to accelerate innovation, control costs, and tap into global expertise. Rather than building and maintaining a large inhouse team, businesses partner with specialized vendors to handle design, development, testing, and deployment.
If you’re a UX designer or product manager wondering how to deliver a better product in terms of usability and userexperience, this is the article for you. Start improving userexperience and usability with user research. How do usability and userexperience differ? Let’s get right to it!
Everything lives in one SDK, with a single interface and one user profile. This cohesion matters when aiming for rapid iterations and consistent userexperiences across the journey, from first-time use to feature reactivation. Collect user feedback effectively with Userpilo t. Build custom user segments with Userpilot.
Reveal Embedded Analytics Today’s business users expect more than static dashboards or delayed reports. That is the promise of self-service BI: giving users direct access to the answers they need without relying on data teams or filing support tickets. You maintain full control over the experience, deployment, and pricing model.
UX deals with a user's interactions with specific aspects of your product, while CX is broader and covers all customer engagements with your brand. TL;DR The userexperience (UX) is the sum of a user's thoughts, impressions, and feelings as they interact with specific aspects of your product.
Companies already using Whatfix for web For teams already leveraging Whatfix on desktop, extending that functionality to mobile ensures a consistent userexperience across platforms. With a shared dashboard and content strategy, you can manage flows, tooltips, and updates without duplicating effort. Whatfix G2 review.
To deliver complex financial solutions with an engaging design at the core, make clients fall in love with a product, and cultivate trustful relations with the audience, businesses can introduce QA to strengthen the development process. To increase working efficiency, users can tweak dashboards and choose the most topical tabs.
Well, you hit two birds with one stone, significantly enhancing both the userexperience and the overall effectiveness of the learningprocess. Here are some key advantages: Improved user engagement: A well-designed application captures users attention and keeps them engaged.
So you can better analyze in-app behavior, whether you’re an app developer, product manager, or part of a growth team looking to optimize every tap, swipe, and session. Mobile app tracking captures data on how users interact with your app, including actions such as screen views, button taps, session length, and feature usage.
Leaders across industries are recognizing this and moving fast to prioritize data democratizationensuring data is accessible to everyoneas a foundation of their SaaS development. This removes the hassle of switching apps or needing specialized training, letting users focus on decisionsnot data gathering.
In its original conception, McClure advocated that companies should dedicate 80% of their efforts to refining existing features and only 20% to developing new ones PostHog,2023. The Emergence of Research-Driven Growth Authentic growth lies not only in analyzing quantitative data but in deeply understanding user behavior and motivations.
Userexperience can make or break a web app. If your software is slow or buggy, users wont stick around for long. If youre only finding out about these issues after users complain, youre already too late. Autocapture events dashboard in Userpilot. Build and view custom dashboards in Userpilot.
Research Phase: Pioneering Your NFT Marketplace Development Vision Before we dive too deep, let’s start by dipping our toes into the research phase — the very beginning of this exciting journey. Growing Demand for NFT Marketplace Development You might be wondering, “Why all the buzz about NFT marketplaces?” What is an NFT Marketplace?
They track 47 different key performance indicators (KPIs) in their mobile analytics platform , spend hours debating dashboard numbers, yet can’t predict which users will churn next week The problem here isn’t a lack of data. Ask targeted questions about specific experiences right when they happen.
It Offers Enhanced Communication and Collaboration Test management tools permit several users to view everything in actual time. This promotes the culture of efficient communication in the complete development team. This provides you with a fast, flexible, and strong userexperience.
3P Learning is an Australian educational technology company that specializes in developing online learning resources. Its products use gamified experiences that help young learners develop science, maths, and literacy skills. They needed a more user-friendly solution. Book a demo to find out more!
“It was a great experience,” says Tali. The developers found it engaging and we had good discussions in which we could focus on opportunities rather than solutions. Another benefit Tali observed was that this increased transparency led to greater trust in the development team among business stakeholders.
Release notes can help your target users realize the full potential of your product. Support the creation of user guides and training materials : The detailed descriptions in release notes help writers understand the purpose and functionality of new features as they create user guides and training materials.
Usability testing: Observe users as they interact with your product to identify usability issues and collect feedback on userexperience. E.g., Identify navigation issues in your analytics dashboard based on real-time user interactions. Survey results dashboard in SurveyMonkey. Dashboard example in Hotjar.
We organize all of the trending information in your field so you don't have to. Join 96,000+ users and stay up to date on the latest articles your peers are reading.
You know about us, now we want to get to know you!
Let's personalize your content
Let's get even more personalized
We recognize your account from another site in our network, please click 'Send Email' below to continue with verifying your account and setting a password.


Let's personalize your content