This site uses cookies to improve your experience. To help us insure we adhere to various privacy regulations, please select your country/region of residence. If you do not select a country, we will assume you are from the United States. Select your Cookie Settings or view our Privacy Policy and Terms of Use.
Cookie Settings
Cookies and similar technologies are used on this website for proper function of the website, for tracking performance analytics and for marketing purposes. We and some of our third-party providers may use cookie data for various purposes. Please review the cookie settings below and choose your preference.
Used for the proper function of the website
Used for monitoring website traffic and interactions
Cookie Settings
Cookies and similar technologies are used on this website for proper function of the website, for tracking performance analytics and for marketing purposes. We and some of our third-party providers may use cookie data for various purposes. Please review the cookie settings below and choose your preference.
Strictly Necessary: Used for the proper function of the website
Performance/Analytics: Used for monitoring website traffic and interactions
With an abundance of product analytics to track, having a robust SaaS KPIdashboard is essential to monitor the metrics that matter most. This guide will walk you through what it is, why you need one, and how to build your very own dashboard. What is a SaaS KPIdashboard? Let’s get into it!
Ever wonder why some products instantly click with users while others get abandoned faster than New Year’s resolutions? The secret often lies in those crucial first moments – your user onboarding. Well, when onboarding new users, that approach is about as effective as trying to fit everyone into the same pair of pants.
Tracking mobile app performance metrics can feel daunting. One look at your mobile app analytics dashboard, and you just want to shut your eyes and scream in frustration. But you find yourself puzzled, overwhelmed, and uncertain about which metrics truly matter. Will this metric help me identify a problem?
You see, although we work hard to make Userpilot the best product adoption tool on the market, we know it isnt the perfect fit for every business. Helping prospects find the right product is a win-win situation. Userpilots key features include: No-code Chrome extension for building in-app flows. Pendo The dashboard on Pendo.
Without measuring and aggressively improving the right mobile app metrics, youll struggle to stay afloat. This article will cover 14 metrics to help you achieve just that. Overview: Mobile app analytics metrics Below is a quick summary of the mobile metrics every PM should be tracking. The competition is stiff.
When you think of Whatfix, your mind probably goes to a digital adoption or an employee onboarding platform. Product teams can use a no-code editor to design step-by-step guidance and interactive elements that live directly inside their mobile apps. The question is: Can Whatfix mobile give you what youre looking for? moment faster.
Guest Post by: Vivek Karna (Mentee, Session 11, The Product Mentor) [Paired with Mentor, John Masterson]. As I strive towards becoming a product leader, I wanted to understand the best practises in product management and in the process develop my own product philosophy. . Introduction. Understanding the Role Definition.
This leads to errors like sending a product update notification at 1 AM or showing the wrong message to the wrong user segment. With push notification marketing, you can nudge a user who just abandoned their cart, bring someone back to continue their onboarding flow , or announce a new feature to your power users while its still hot.
Its not just the design, features, or marketing. I mean what happens after the download: how users navigate, what features they engage with, and where they drop off. Mobile app tracking captures data on how users interact with your app, including actions such as screen views, button taps, session length, and feature usage.
Poor performance includes slow loading times, complex design, confusing navigation, and unresponsive features. This article will help reduce such churn by refining your product management and UX analysis approach. UX analytics involves gathering, analyzing, and interpreting data about how users interact with your product or service.
A product adoption dashboard helps you visualize key adoption metrics so you can make data-driven decisions and boost user engagement. In this article, we cover the following: Why you need a product adoption dashboard. Steps to measure adoption using a comprehensive dashboard. Define your main objectives.
Think of Net Promoter Score (NPS) software as a tool to measure your customers’ feelings about your product, and categorize them based on their level of loyalty (promoters, neutrals, and detractors). 1 Userpilot for product teams to collect and act on NPS data Creating NPS surveys with Userpilot.
When it comes to product management, you need to look at different SaaS dashboard examples to see what kind of product analytics you can measure, and how. So what are the most important types of dashboards and which ones are the best for you? Example of NPS dashboard in Userpilot.
Tracking the right user metrics helps you precisely identify issues in the product experience rather than feeling lost in a sea of data. Choosing the wrong KPIs can be more damaging than you think – it drains your teams resources, shifts focus away from real problems, and ultimately, disrupts the customer experience.
When you’re building a mobile product , data is your lifeline. Whether for tracking feature adoption or spotting drop-off points, the right analytics tool can make or break your growth. Some tools are great for marketers, and others are for product or development teams.
We covered everything from features to pricing, along with insights from real users. It helps app owners guide new users, promote feature adoption , and deliver employee training, all within the mobile app experience. Segmentation and targeting: WalkMe lets you create separate user groups for better personalization.
A product analytics dashboard helps you visualize user behavior, so you can make informed decisions on how to improve product engagement. In this article, we cover the following: Why you need an analytics dashboard. The types of metrics to track in your dashboard. What is an analytics dashboard?
Wondering how to build a customer success dashboard for your team? From the article, you will learn what a customer success dashboard is, why you need it, and what metrics it should include. And how to build a dashboard for your customer success team using Userpilot analytics ! Why does your team need a CS dashboard?
It’s no secret that learning how to evaluate product performance is essential for product management. But how can you effectively measure productmetrics that can help you reach your goals and increase revenue growth? Why not book a Userpilot demo to see how you can analyze and improve product performance continuously?
Are you wondering how the new Userpilot custom analytics dashboards can help you drive product growth? In this article, you will learn about the main benefits of custom product analytics dashboards and how to create them in Userpilot. They were an excellent aid to product teams trying to optimize these metrics.
Whether you’re introducing a new product, releasing an upgrade, or announcing advanced features, outlining a product launch strategy can help align your efforts in the right direction. That’s where product launch analytics step into the picture. The key is to monitor all the data and optimize your strategy at each step.
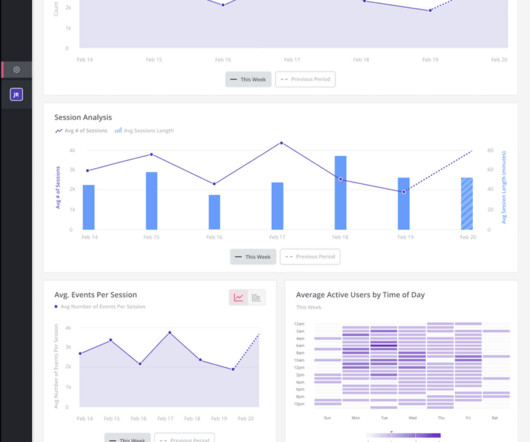
By combining contextual insights from session replays , heatmaps, and behavior analytics, user session analysis helps you interpret metrics through the lens of real user journeys. Imagine a product team celebrating a 200% spike in sign-ups after a promotional campaign. On the surface, it looks like a win.
Leveraging product analytics isnt just about making pretty dashboards; its about viewing your existing data as a learning opportunity to make informed decisions with your onboarding strategy. Start with your core business goals and map out 3-5 key metrics that directly support these objectives. How to solve this issue?
Through case studies, statistical evidence, and methodological frameworks, I aimed to establish how systematic user research can positively impact key business metrics, from acquisition to referral. Additional statistics reinforce this argument: 74% of SaaS companies consider their product the primary driver of growth OpenView, 2022.
” And that’s also why AARRR metrics are called pirate metrics. Short for acquisition, activation, retention, referral, and revenue, these metrics help you measure and drive product growth. In this article, we’ll dig deeper into the AARRR framework and the relevant metrics associated with each stage.
Incorporating these tools into your customer experience tech stack will drive more engagement, deliver high-quality customer feedback, and help inform your product roadmap. This in-app analytics tool helps companies make data-driven iterations to their apps and gain a better understanding of how product changes impact customer satisfaction.
Want to track the different types of productmetrics to get product growth insights ? Productmetrics are critical for product growth managers to develop the right product strategies and drive continuous value for customers. You can also use a productmetrics framework, ie.
Incorporating these tools into your customer experience tech stack will drive more engagement, gather high-quality customer feedback, and help inform your product roadmap. Developers can remove the pains associated with constantly incorporating new SDKs into an app and focus on delivering products that transform the customer experience.
What happens when you build a product or service around what you think potential customers want, only for them to buy something else? But worse than that, it leads to lower revenue, failed products, and plummeting customer loyalty. Does customer research help build better products? The short answer: yes.
Researching customer onboarding strategies for your SaaS product? The article shares 17 tried-and-tested customer onboarding tactics that will help you build delightful user experiences and drive product growth. Create a welcome series of in-app and email messages to greet users and kick off onboarding.
Our production environment is where our code, infrastructure, third-party dependencies, and our customers come together to create an objective reality – it’s the only place to learn and validate the impact of our work. We define observability as a continuous process of humans asking questions about production, and getting answers*.
‘How to optimize your productmetrics for growth’ by Dan Olsen is one of the talks in this year’s Product Drive hosted by Userpilot. In this article, you will learn who Dan Olsen is, discover the core ideas from his book The Lean Product Playbook, and find out what you can expect from his talk.
Not sure what metrics you should use? TL;DR Martech success can be defined as the ability of the product to satisfy customer needs and drive business goals. One way to measure your Martech product success is by using benchmarks to compare its performance to similar products. Core feature adoption rate : 27.9%
On this week’s show, we catch up with email marketing strategist, Val Geisler, as she walks us through some practical emailing tips, her process for onboarding, and why she likens career progression to a spiral staircase. Think about onboarding like you’re hosting a dinner party. That’s what I went to school for.
Tracking product analytics , such as feature usage, is useful for understanding feature adoption and user engagement. TL;DR The feature usage rate is an engagement metric that measures the number of users who have adopted a specific or new feature within your product.
Looking to drive adoption with contextual user onboarding ? As any savvy product manager will know, picking the right tool is essential to the success of your SaaS – so it’s worth taking the time to choose carefully. Another impressive dimension of Userpilot’s software is event tracking and feature tagging.
The right customer analytics platform helps you uncover exactly how customers interact with your product: so you can spot issues early, optimize user journeys, and drive sustainable growth. With a reliable analytics solution , you wont miss critical signals or overlook game-changing insights that could increase product adoption.
These days, customers expect instant access to support, especially for products that are critical to their business operations. If people can buy your product in their native language, they should be able to receive support in their native language as well. Consistent customer experience. Same thing in Australia.
Last week we launched a series of new features to help modern support teams handle rising volumes of complex conversations with confidence and efficiency. Want to see these features in action? Our newest product upgrades solve three main challenges for support teams: 1. New reporting metrics for more detailed insights.
Incorporating these tools into your customer experience tech stack will drive more engagement, gather high-quality customer feedback, and help inform your product roadmap. Developers can remove the pains associated with constantly incorporating new SDKs into an app and focus on delivering products that transform the customer experience.
Wondering how Aha moments lead to feature and product adoption? The articles explains what the Aha moment is and what role it plays in user activation, product adoption , and customer retention. You will also learn how to find the Aha moment for your product and optimize it for different users. Ready to dive in?
User onboarding is one thing that can make or break your product. Get it wrong and your product will be plagued by churn, declining revenue, and poor customer reviews. So how do you make sure how you provide an excellent onboarding experience to your customers? Primary onboarding helps new users experience the Aha!
You know your product collects tons of data. Because product analytics should be easy and accessible for everyone, not just data experts. In this guide, well break down the top data visualization tools for product teams, so you can stop guessing and start making smarter, data-driven decisions. What are data visualization tools?
With cross-platform tracking, real-time analytics, powerful behavioral analytics , enterprise-level security measures, and solid customer support, Amplitude Analytics is a powerful analytics solution designed to meet the requirements of modern-day product and growth teams. Heap tells you all about what a customer is doing within your product.
We organize all of the trending information in your field so you don't have to. Join 96,000+ users and stay up to date on the latest articles your peers are reading.
You know about us, now we want to get to know you!
Let's personalize your content
Let's get even more personalized
We recognize your account from another site in our network, please click 'Send Email' below to continue with verifying your account and setting a password.


Let's personalize your content