article thumbnail

Dashboard That Works: A Step-by-Step Guide for Startups in 2025

UX Planet

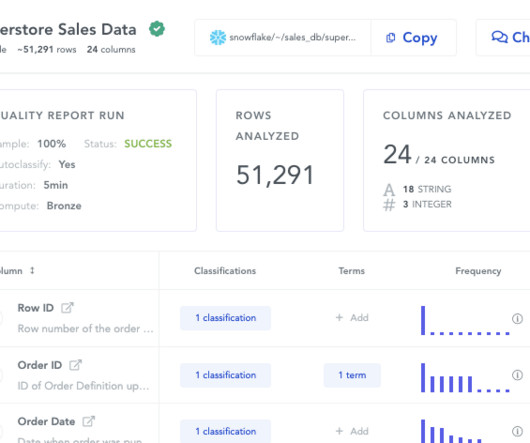
How to plan a dashboard people will use: 10 Key Steps Dashboard user interface elements in light and dark modes Our team has built dashboards for a wide range of businesses, and we’ve picked up a few key insights along the way. If you want a solid dashboard, treat its design as seriously as you would an airplane’s cockpit.

article thumbnail

How to Interpret Customer Data with Data Visualization Tools: Expert Insights for Product Teams

Userpilot

Communicate findings effectively A well-structured custom dashboard makes it easier for you to share insights across teams. When we launch a new feature, we create a funnel dashboard to measure how many users discover, activate, and keep using it. Tableau: Best for exploring complex datasets with interactive visuals.

Insiders

Sign Up for our Newsletter

This site is protected by reCAPTCHA and the Google Privacy Policy and Terms of Service apply.

article thumbnail

Top 10 Customer Analytics Platforms for Product and Growth Teams

Userpilot

Tableau – the best data points visualization software. Factors I consider when evaluating customer analytics tools Important core features Analytics dashboards : Provide real-time visualizations of key performance indicators (like active users and page views) at a glance, so you can easily track changes.

article thumbnail

The Ultimate Guide to Embedded Analytics Requirements for 2025

Reveal

Traditionally, companies have tackled analytics through two main approaches: Centralized Teams: Data-savvy users work with specialized tools like Tableau, Excel, or Jupyter Notebook. Visualization: Presenting data through intuitive charts, dashboards, or reports.

article thumbnail

Monetizing Analytics Features: Why Data Visualizations Will Never Be Enough

But today, dashboards and visualizations have become table stakes. Think your customers will pay more for data visualizations in your application? Five years ago they may have. Discover which features will differentiate your application and maximize the ROI of your embedded analytics. Brought to you by Logi Analytics.

article thumbnail

What is Self-Service BI: Benefits, Use Tools, Considerations 

Reveal

Reveal Embedded Analytics Today’s business users expect more than static dashboards or delayed reports. Here is what best-in-class embedded self-service BI should deliver: Simple Dashboard Creation : Drag-and-drop editors your users actually want to use. You are not simply looking for drag-and-drop dashboards.

article thumbnail

How Product Managers Can Build Better Dashboards (Without Data-Team Bottlenecks)

Productside

The Before-and-After Story: Heavy Stack ➜ Self-Service Product Analytics Before: At Tanya’s previous unicorn, data lived in a “very massive and cumbersome” stack: ETL pipelines, Snowflake, Tableau and Amplitude. And every new dashboard sat “a month” away in an analyst backlog. Annual tool cost: ~$150 K. instead of decorating slides.