Remove Data Visualization Remove Embedded Analytics Remove Information
article thumbnail

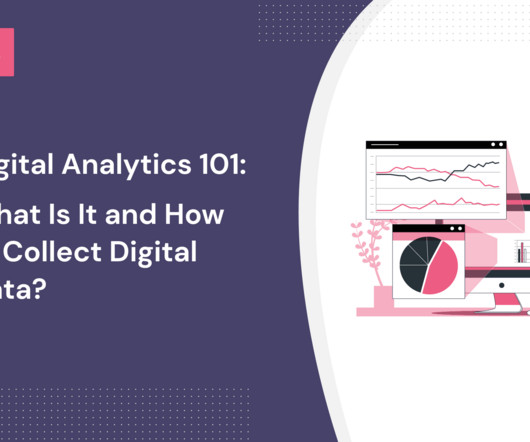
Product Analytics: Guide for Product Owners in 2025

Reveal

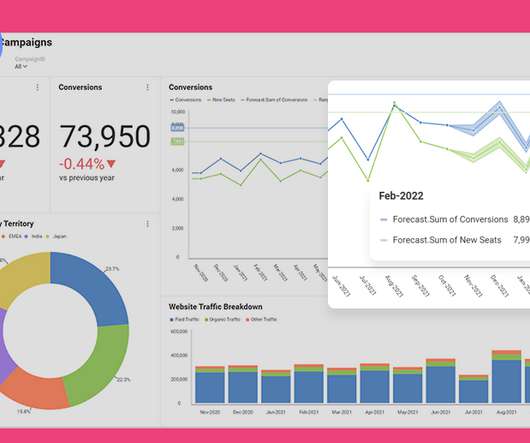
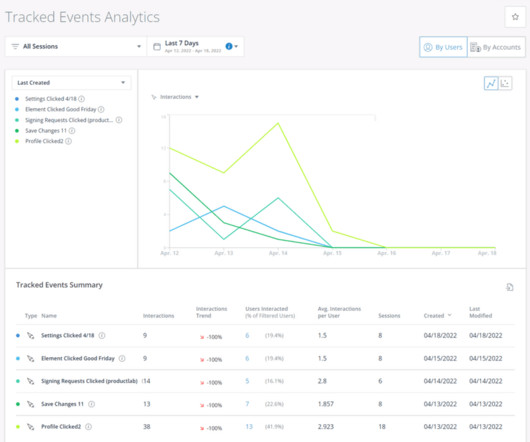
Reveal Embedded Analytics For product owners, leveraging data is not just an advantageits a necessity. Product analytics empowers you to understand gaps in your offering and how users engage with your product. Both embedded analytics and product analytics are designed to help product owners in diverse ways.

article thumbnail

Choosing the Right Angular Dashboard Library for Your Next Project 

Reveal

Reveal Embedded Analytics We know how difficult it is to create dashboards, especially for web applications. However, running business operations or targeted campaigns without insights into their effectiveness is not an option. Thats what dashboards are for. What is an Angular Dashboard Library? Dont worry.

Insiders

Sign Up for our Newsletter

This site is protected by reCAPTCHA and the Google Privacy Policy and Terms of Service apply.

article thumbnail

Top 12 Dashboard Reporting Tools For SaaS in 2024

Userpilot

As you’re researching dashboard reporting tools, you’ve probably noticed how hard it is to find reliable information on the available solutions. TL;DR Dashboards display critical business data in real-time, streamlining decision-making and focusing on key metrics. Let’s dive in!

article thumbnail

Business Intelligence Analyst Career Path

Userpilot

Starting a career as a business intelligence analyst requires understanding the key steps, skills, and experiences needed for success. In this article, we will outline the typical journey for business intelligence analysts, covering educational requirements, entry-level positions, potential advancements, and long-term opportunities.

article thumbnail

Monetizing Analytics Features: Why Data Visualizations Will Never Be Enough

Think your customers will pay more for data visualizations in your application? But today, dashboards and visualizations have become table stakes. Discover which features will differentiate your application and maximize the ROI of your embedded analytics. Brought to you by Logi Analytics.

article thumbnail

How to Build Your Dream Analytics Stack

Indicative

Every company, of every size — even organizations of just one person — are navigating a data avalanche problem. There’s more information on hand than organizations know how to use or manage. Every team — from product to marketing, and IT to engineering — is generating data. Data Tracking and Collection. Event Data.

article thumbnail

What is Data Visualization? + Visual Data Tools

Userpilot

Visual data surrounds us – colorful charts on weather reports, infographics on the web and in social media articles, map charts in presentations, etc. To help you get started with data visualization, this article explores various visualization methods and their use cases. Funnel charts. Pie charts.