This site uses cookies to improve your experience. To help us insure we adhere to various privacy regulations, please select your country/region of residence. If you do not select a country, we will assume you are from the United States. Select your Cookie Settings or view our Privacy Policy and Terms of Use.
Cookie Settings
Cookies and similar technologies are used on this website for proper function of the website, for tracking performance analytics and for marketing purposes. We and some of our third-party providers may use cookie data for various purposes. Please review the cookie settings below and choose your preference.
Used for the proper function of the website
Used for monitoring website traffic and interactions
Cookie Settings
Cookies and similar technologies are used on this website for proper function of the website, for tracking performance analytics and for marketing purposes. We and some of our third-party providers may use cookie data for various purposes. Please review the cookie settings below and choose your preference.
Strictly Necessary: Used for the proper function of the website
Performance/Analytics: Used for monitoring website traffic and interactions
Listen to the audio version of this article: [link] A Product Strategy System The product strategy system in Figure 1 consists of four main parts: people, processes, principles, and tools. Having said this, the system in Figure 1 captures the specific product strategy approach Ive created. [1] Are the right tools applied?
” Solution-centric data : “We’re making great progress; we’ve implemented 50 more user stories, and velocity is up by eight points!” ” Sadly, the data above is not helpful to see clearly how much value the product is creating. 2 Wrong Product KPIs. This often leads to too much data being gathered.
This post is about making these ideas concrete through a set of guidelines, templates, and JIRA+Excel tips so you can create effective status and progress reports quickly, have less meetings , and get out of the building , which is where you need to be. Goals / KPIs. What’s the current status of our goal/KPI?
With an abundance of product analytics to track, having a robust SaaS KPIdashboard is essential to monitor the metrics that matter most. This guide will walk you through what it is, why you need one, and how to build your very own dashboard. What is a SaaS KPIdashboard? Why do you need SaaS dashboards?
As the PM, your job is to find out how the campaign is performing, how the feature is working, how users are reacting to the new feature, what impact has the feature had your engagement and business KPIs, etc. That’s where investing time and energy into building an operations dashboard will pay dividend for years to come.
If your business is expanding internationally, you’ll reach a point in your growth when you’ll need to implement a global support strategy. Global support teams can positively influence customer retention, especially if they provide service in their customers’ native language. Improved global customer retention.
Modern customers expect quick, personal, and effective service. But with so much data to consider, how can you define the help desk metrics that matter for your team? As Seth Godin once put it: “Don’t measure anything unless the data helps you make a better decision or change your actions.” What are help desk metrics?
Using KPIs and collecting the relevant data helps you balance intuition with empirical evidence. A Goal-directed Approach to Choosing KPIs. To select the right KPIs, I recommend taking the following three steps: First, use the user and business goals in the product strategy to select an initial set of indicators.
As you’re researching customer analytics platforms, you’ve probably noticed how hard it is to find reliable information on the available solutions. TL;DR Customer analytics platforms are specialized tools that allow you to collect and analyze data. Starts with Einsten Predictions’ $75/month billed annually.)
Wondering how to build a customer success dashboard for your team? From the article, you will learn what a customer success dashboard is, why you need it, and what metrics it should include. And how to build a dashboard for your customer success team using Userpilot analytics ! Why does your team need a CS dashboard?
The technical skills our respondents possess increased from there, with 25 percent of respondents reporting strong technical skills (i.e. Go beyond NPS as a core KPI. When the “why” behind the data doesn’t exist, it’s impossible to make strategic decisions.NPS is the best measure of customer loyalty.
From learning more about their career path to predicted trends to general tips and advice, there’s no shortage of lessons to be learned that can ultimately help you develop and become a better product expert yourself. What strategies do you use to prioritize your product roadmap? What tools or methodologies do you use?
In SaaS, a new user activation dashboard can become a massive product analyticstool to understand and optimize the user journey. But how can a dashboard for user activation can help you engage more users? moment ," where the core value proposition of your service becomes clear and tangible.
Fueled by product insights and strategy, the work exceeded every key metric. Written by Michael Agombar Many times, we see a client’s data collection methods to be lacking, in which case we create analytic tracking plans. When we jump into analytics, we have a few goals.
When it comes to boosting your product growth, user tracking tools can make your life a lot easier. They offer insights into product performance , what your users are doing inside your product, and why they are doing it. But how do you know you’re picking the right tools? Tableau is the best user datavisualizationtool.
Like any form of analytics, product marketing analytics is all about capturing key data and optimizing the customer experience using that data. Unlike marketing analytics which focuses on replicating marketing successes, product analytics focuses on improving the product. What is product analytics?
Customer satisfaction analytics are key to understanding what makes your customers happy and building a product that retains users. But how can you leverage this user sentiment data to lead product development and grow your business? There’s no single KPI to measure customer satisfaction.
When it comes to KPIs vs metrics, which one should you measure to get better insights? Metrics and KPIs are often used interchangeably, but they also have differences. The more you understand these nuances, the better you can evaluate your product growth strategy. In this article, you will learn: What is a KPI in SaaS?
And I love graphs, metrics, and the data that powers them because they communicate results and inspire ideas. And at the heart of the OKR system lies metrics and data. So I took these and worked with our data science and customer success teams to understand the product metrics (KPI’s) that influence these results the most.
There are many parts to a high-performing sales organization – the right people, processes and strategy, to start. But today, the underlying backbone of all of it is the right data. While science has always been part of sales, it’s hard to ignore the increasing importance of taking a data-driven approach to growing your business.
Do you need some behavioral KPI examples to understand what metrics to track and why? Behavioral key performance indicators (KPIs) can help you understand user experience and measure feature adoption. Then you can use its valuable insights to make data-driven decisions for your SaaS business. What are behavioral KPIs?
Have you noticed recently an increase in the usage of the terms ‘data-driven’, ‘data-informed’, and ‘data-inspired’ around your office? What does data-inspired actually mean and how is it different from being data-informed? Data-driven, data-informed, and data-inspired describe how data should be used.
According to Gartner, more than 3,000 CIOs ranked Business Intelligence (BI) and Analytics as the top differentiating technology for their organizations. If BI and Analytics is such a game-changer, then why is the average adoption rate in organizations only 32%? On Jan 29, Birst will introduce Smart Analytics powered by Coleman AI.
How do you deliver more insights out to more people? Operationalizing BI and analytics – that is, putting the power of data in the hands of everyone across the enterprise, not just analysts and data scientists – has always been the mantra for Birst co-founder Brad Peters. Do you see the bottleneck?
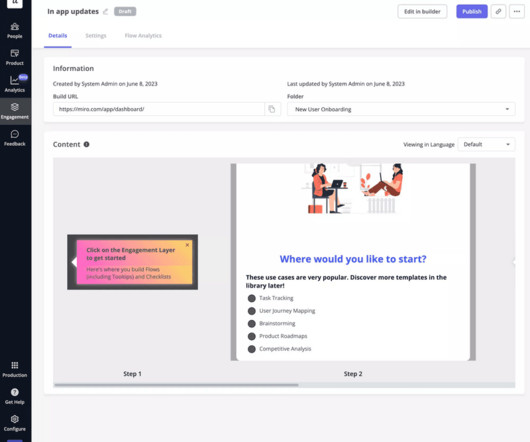
If you’re a financial services product manager, you’ll know that crafting an effective fintech app onboarding process is no small feat. There are challenges unique to financial services that become magnified when dealing with mobile devices. Chances are the ones you frequently use have a simple, intuitive app onboarding process.
To give you a general idea of where the mobile playing field is today, here are a few 2020 stats from our friends at App Annie : App Annie’s State of Mobile report is a fantastic place to start when looking for a general lay of the land and high-level stats. as well as from implicit data (favorited items, past purchasing behavior, etc.).
All of this could have been avoided if you’d been tracking leading indicators of success, were monitoring these metrics properly, and had experimented with new ways to improve your product (the lemonade) and growth strategy (luring in thirsty neighbors). No stock definition or out-of-the-box dashboard can capture this for you.
Having trouble deciding which customer serviceKPI to use? There are some vanity metrics among the KPIs for customer service. So let’s look at the most important KPIs that will help you create strategies to provide superior customer service and boost retention. What are customer serviceKPIs?
To keep up with these changes, last year we released our first Intercom Customer Support Trends Report. The report highlighted how support teams were adopting conversational support tools to meet rising customer expectations and a flood of inbound queries. Last month, we published the second edition. Fast forward one year.
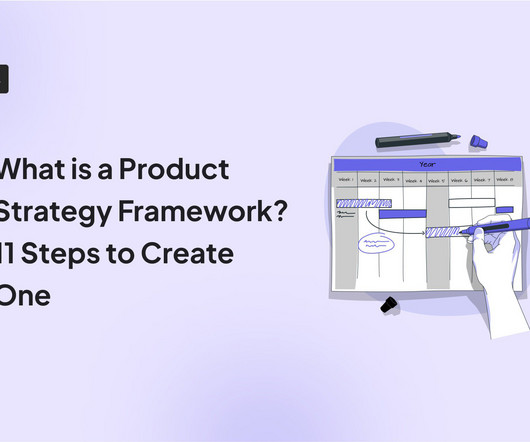
Launching a product without a well-defined product strategy framework is similar—you risk wasting resources without a clear path to success. So, how do you outline a product strategy framework that is the foundation of product-led growth ? Product strategies help you design and grow your products. Let’s get right to it.
Recommended product manager job openings in data-driven companies 1. Someone who thrives in ambiguity and can translate complex problems into clear, actionable strategies. A professional with strong analytical skills, capable of leveraging datainsights to drive strategic decisions.
However, there are simply not enough data scientists in the world to deliver on the AI potential. Data scientists building AI applications require numerous skills – datavisualization, data cleansing, artificial intelligence algorithm selection and diagnostics. The Outsourcing of Data Science Functions.
They help you measure success, identify areas for improvement, and align your product management strategies with your overall business goals. That said, let’s explore the most critical product marketing metrics to track, along with the latest benchmarks in 2024: Check out the 2024 Benchmark Report.
The data obtained from the process lets you adapt and refine your strategies, ensuring you make proactive moves to improve key growth metrics. The best visualization types to make actionable decisions from your analysis. Determine the right analysis report to use. Customize data points.
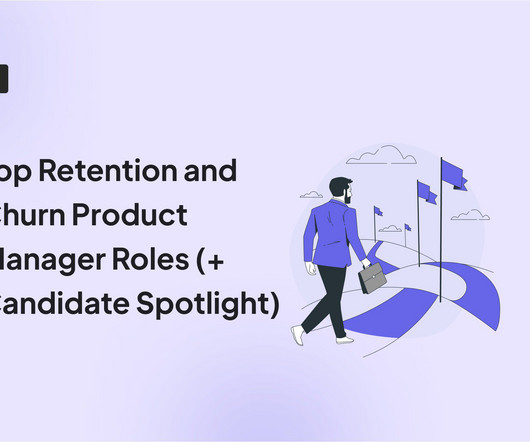
Similar to downloads, tracking new signups can yield interesting insights. It is an indispensable KPI because it indicates how many of your users have stayed loyal. . This metric is difficult to grow organically; therefore, retention numbers should be a major KPI from day one. Churn rate is the opposite of retention rate.
The foremost way companies know which features to allocate their time toward building is by establishing key performance indicators (KPIs). Everything should always go back to the data and metrics! As companies usually have many different KPIs, maintaining or growing customer retention is a key KPI that each business commonly shares.
Data Driven Expectations and Validation Shot in Budapest in 2018 during our MBA trip Setting the Context Product Managers often start with an Outside-In perspective. An insightful discussion and probing questions drive a better and more sustainable solution that results in better value creation and capture. The Return of the King?—?Data
That’s what real-time analyticstools can provide. What is real-time analytics? According to Gartner, real-time analytics means that the analysis happens within seconds after new data is received. Apps aren’t predictable once you release them into the real world. Time is not on your side.
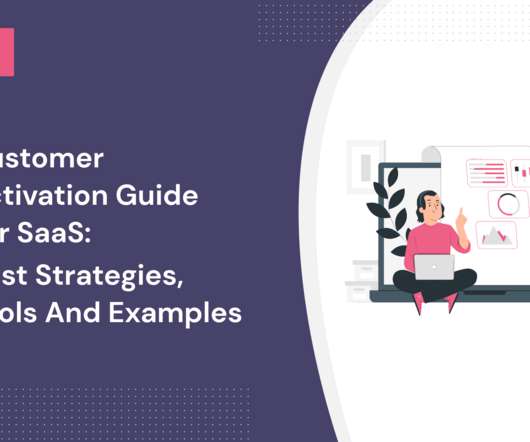
In this comprehensive guide, we’ll break down underlying customer activation strategies and actionable strategies, specific onboarding tools , and techniques, and tangible examples to learn from. How can you craft an effective customer activation strategy of your own? What are you waiting for?
Using KPIs and collecting the relevant data helps you balance intuition with empirical evidence. A Goal-directed Approach to Choosing KPIs. To select the right KPIs, I recommend taking the following three steps: First, use the user and business goals in the product strategy to select an initial set of indicators.
Along with affordable pet boarding provided by insured pet sitters, Mad Paws provides other services for pet owners such as dog walking and pet sitting. How Mad Paws uses analytics to learn more about their business and woo investors. Mixpanel: Can you speak about how, as a start-up, you use data to attract investors?
Customer journey KPIs, alongside product analytics , help product teams understand if they’re meeting their goals. This insight can help you make informed decisions to optimize your user experience. How to choose the right customer journey KPIs? Book a demo today to see it in action!
Moreover, marketing teams can easily identify and assess different channels and tactics thanks to modern marketing-monitoring tools, like SERP Tracker. These tools help marketing managers collect valuable data about their marketing campaigns for better decision making. Why do you need marketing KPIs?
Moreover, marketing teams can easily identify and assess different channels and tactics thanks to modern marketing-monitoring tools. These tools help marketing managers collect valuable data about their marketing campaigns for better decision making. Why do you need marketing KPIs? This is where KPIs come in.
We organize all of the trending information in your field so you don't have to. Join 96,000+ users and stay up to date on the latest articles your peers are reading.
You know about us, now we want to get to know you!
Let's personalize your content
Let's get even more personalized
We recognize your account from another site in our network, please click 'Send Email' below to continue with verifying your account and setting a password.


Let's personalize your content