This site uses cookies to improve your experience. To help us insure we adhere to various privacy regulations, please select your country/region of residence. If you do not select a country, we will assume you are from the United States. Select your Cookie Settings or view our Privacy Policy and Terms of Use.
Cookie Settings
Cookies and similar technologies are used on this website for proper function of the website, for tracking performance analytics and for marketing purposes. We and some of our third-party providers may use cookie data for various purposes. Please review the cookie settings below and choose your preference.
Used for the proper function of the website
Used for monitoring website traffic and interactions
Cookie Settings
Cookies and similar technologies are used on this website for proper function of the website, for tracking performance analytics and for marketing purposes. We and some of our third-party providers may use cookie data for various purposes. Please review the cookie settings below and choose your preference.
Strictly Necessary: Used for the proper function of the website
Performance/Analytics: Used for monitoring website traffic and interactions
Let’s review everything your customer success team has to do in the absence of any customer success tools. Collect customer data to calculate complex formulas for tracking metrics, monitor customer health scores, and resolve support tickets while continuously trying to improve retention and expansion.
New research from Harvard Business ReviewAnalyticServices reveals that businesses of all sizes – from small businesses to enterprises – are realizing the business value of personal, efficient customer engagement. Below, we take a deeper dive into the report’s key data and trends. But they’re facing big barriers.
Most product teams get mobile app analytics wrong. They track 47 different key performance indicators (KPIs) in their mobile analytics platform , spend hours debating dashboard numbers, yet can’t predict which users will churn next week The problem here isn’t a lack of data.
When your company adopts multiple SaaS solutions to drive productivity, you unknowingly create a perfect storm for data fragmentation. Your customer information lives in Salesforce, while your support tickets are in Zendesk, your product usage data in Mixpanel, and your marketing campaigns in HubSpot. Sound familiar?
Download this Special Report by MIT Sloan Management Review to learn about: The concept of radicalness and how its intertwined with innovations Innovative governance ideas that have the potential to influence organizational changes Simple decisions that can set teams on a path toward either incremental or breakthrough innovations
How product managers can use AI to get more actionable insights from qualitative data Today we are talking about using qualitative data to drive our work in product and consequently improve sales. ” Then the product leader goes to some poor associate PdM and asks them to collate all of the data together.
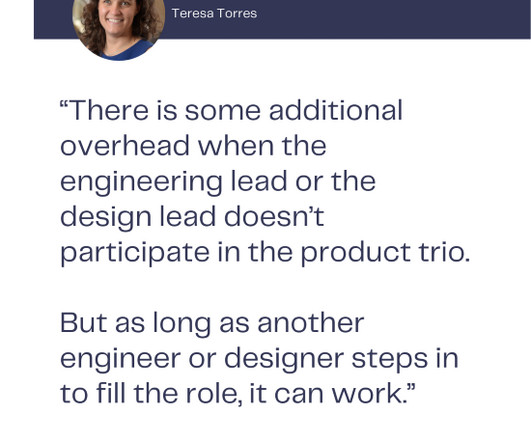
It is not expected (nor is it the norm) for the other designers on the team to report to the design lead nor for the other engineers on the team to report to the engineering lead. Our more senior engineer might be most interested in system architecture, code reviews, and mentoring other engineers.
In the retail industry, customer feedback is your early warning system, your innovation engine, and your most honest performance review. But this system only works if you take action on the feedback collected. Heres how to take insights from customer feedback and turn them into results. Level it up! The post Retailers.
The collaboration between AMS and MIT researchers has yielded impressive results, with AI tools not only matching human analysts in identifying customer needs but often exceeding themespecially for emotional needs that humans might overlook. But it is changing, with AI tools that are transforming how we uncover and analyze customer needs.
In this Whatfix Mobile review, youll find answers to three questions: What does Whatfix Mobile offer? Whatfix delivers context-aware guidance that helps users correctly complete sensitive tasks like handling patient documents, uploading payroll data, etc., However, advanced behavior targeting requires a separate analytics integration.
Marketing leader, Justin Norris shares recommendations for how to produce valuable reporting for stakeholders. Let’s say in this case, the digital product is a report. When a stakeholder requests a report, whether they tell you this or not, they made the request so they can get something done. Understand the business problem.
Case Study: Improving Data-Driven Decision Making for CSR Leadership Civian is a data-driven platform designed to help businesses measure, optimize, and showcase the social and economic impact of their investments in communities. Feature Engagement Users most frequently gravitated toward the map to explore and compare data.
I’m going to take a wild guess and assume that you already understand the importance of mobile in-app feedback tools. You also might be reading this post thinking: “Who’s adding new tools to their tech stack right now?” Do you have the right tools to capture that voice? Mobile in-app feedback tools & solutions.
They need to be able to understand the analytics behind customer interaction and response rates so they can make data-driven decisions. Looking at individual systems, the response rate is 94% on iOS and 88% on Android. The data shows that customers clearly want to share feedback, proven by the remarkable 91% response rate.
To better understand the common challenges organizations face with digital feedback tools, we conducted a comprehensive market research study that revealed several critical pain points. When one tool gathers feedback via email and another through your website, consolidating all that data and customer feedback can be nearly impossible.
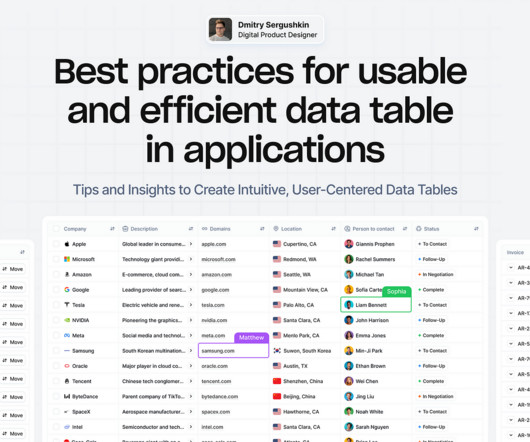
Tips and Insights to Create Intuitive, User-Centered DataTables Data tables provide a structured way to organize and manage information, making it easier to analyze and visualizedata effectively. However, creating effective data tables is not as simple as organizing rows and columns.
Reveal Embedded Analytics We know how difficult it is to create dashboards, especially for web applications. However, running business operations or targeted campaigns without insights into their effectiveness is not an option. Thats what dashboards are for. They track everything from user behavior to system performance.
Tracking user behavior analytics in mobile apps is a whole different challenge compared to the web. Without a global DOM or easy auto-capture tools, tracking mobile app user behavior takes more planning. And the behavioral data you do collect depends on what you choose to track and how you track it. Mobile analytics ?
Thats where real user monitoring tools come inthey provide real-time insights into how users engage with the app , helping you detect performance issues before they impact your bottom line. Third-party integration: Supports integration with analytics, and DevOps tools like Google Analytics, Mixpanel, Splunk, or Datadog.
Last month we turned our attention to data – unleashing new features that help you improve how you collect, access, and use first-party data to influence your product and scale your business. Surveys: Now even more insightful and engaging. Gain deeper insights with advanced reporting for Surveys.
What happens when you build a product or service around what you think potential customers want, only for them to buy something else? According to Harvard Business Review, 80% of new products fail, primarily because companies fail to conduct proper customer research. For starters, it shows you dont know your customers well enough.
Customer churn is one of the biggest challenges businesses face, yet many organizations struggle to accurately predict and prevent it. With the emergence of AI-powered customer intelligence software , businesses now have a transformative tool to predict churn risks and act before customers leave. companies lose $136.8
A self-servicedata platform is the backbone of informed decision-making and a growing SaaS business. But how do you choose the right data platform for product analytics ? Let’s go over what a data platform is, its importance, and the must-have features you should consider to choose the right platform for you.
In today’s competitive landscape, customer experience (CX) stands as a cornerstone of success, particularly in the financial services industry. Whether through surveys, online reviews, or direct interactions, gathering actionable feedback provides invaluable insights into areas for improvement.
90% of the world’s data has been created in the past 2 years, and businesses spend more than $180 billion annually on big dataanalytics. Since our first ancestors began writing on parchment, data has been an integral part of the human experience. What is big dataanalytics? But how is it used?
Nearly 60% of mobile teams still rely on self-hosted push tools. They trade short-term savings for long-term pain: no analytics, poor timing control, and zero personalization. This is where self-hosted systems often fail. Use user data (name, location, preferences, past behaviors) to send relevant, personalized notifications.
As a product manager at Userpilot, I’ve had the chance (and let’s be honest, responsibility) to try out major onboarding automation tools in this space. In this post, I’ll walk you through how these tools compare based on actual, hands-on use, not just pricing tables and feature checklists. Starts at $300/month for 1,000 MAUs.
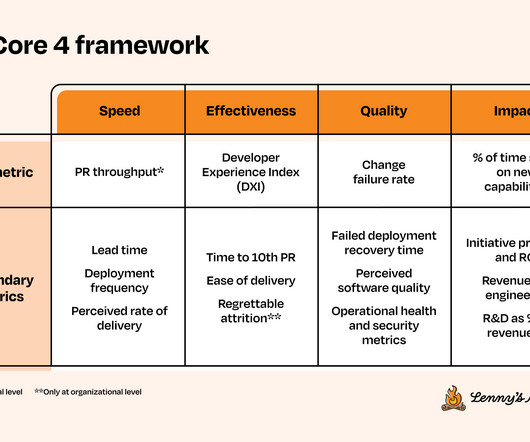
Her background is in developer tools and distributed systems. These metrics are designed to be used together as a system to provide a balanced look at overall team performance. It’s important that this metric is used only as a system health metric, and always alongside other metrics in the framework.
If so, you need to invest in the right customer insighttools. These tools are perfect for providing valuable customer insights to make product improvements and optimize your customer experience. Businesses collect customer insights through data monitoring, surveys , interviews, support interactions , and social media.
In our 2021 Mobile App Engagement Benchmark Report , a study of 1,000 apps across a billion+ app installs, we take a close look at apps in the Education category. Read on for data-supported research and benchmarks Education apps should focus on in 2021 and beyond based on what was learned from a year like no other.
Analyticstools offer a competitive advantage for companies investing in prolonged product growth. However, not all companies can invest precious resources in an analyticstool. In reality, some companies are better served using free vs paid analytics platforms. There are different types of analyticstools.
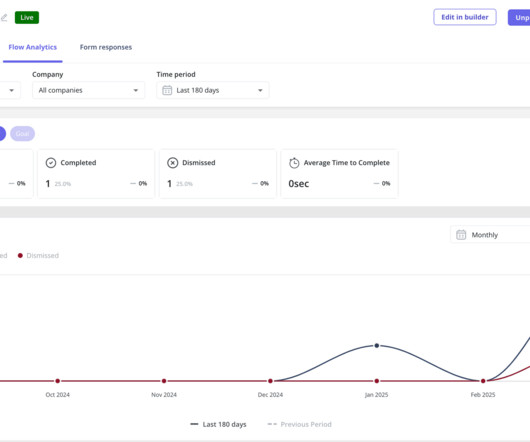
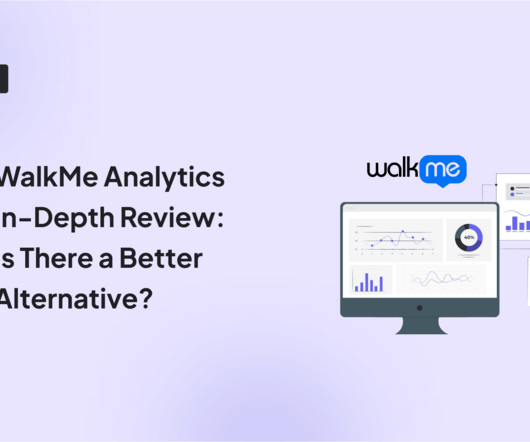
What analytics features does WalkMe support? You will also discover three alternatives to WalkMe and learn about their analytics capabilities. The WalkMe Insights platform forms the core of WalkMe analytics. The specific analytics features available differ between the customer and employee onboarding solutions.
Often, this is due to resource constraints rather than a lack of understanding of a PM role. Data PM: organizations dealing in data products (building AI/ML based products) prefer a PM with data science background so that they can appreciate the problems well and being able to work with data engineers/scientists.
After every discussion with customers, sales, service, leadership and my colleagues, I was left with a laundry list of problems that needed my attention. One of those goals was to reduce the overall cost of service across the organization. In this instance, the metric that reflected this goal was “call volume to the service team”.
How product managers can use AI to work more efficiently Watch on YouTube [link] TLDR AI is changing how we manage products and come up with new ideas, giving us new tools to work faster and be more creative. The future of product management will involve using more AI tools, like advanced language models and creating fake data for testing.
In our 2021 Mobile App Engagement Benchmark Report , a study of 1,000 apps across a billion+ app installs, we take a close look at apps in the Food and Drink category. Read on for data-supported research and benchmarks Food and Drink apps should focus on in 2021 and beyond based on what was learned from a year like no other.
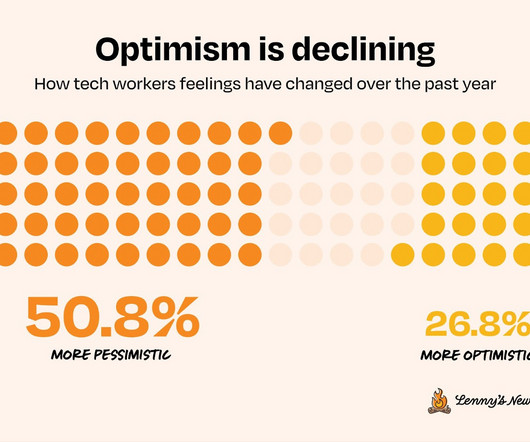
Today, with insights from over 8,200 of you (thank you to everyone who participated!), 60% of extremely pessimistic respondents reported high burnout. Only 8% of extremely optimistic respondents reported that they’re highly burned-out. reporting optimistic feelings and only 25.1% Subscribe now.
The “shiny penny” approach (focus all your attention on the hottest tools in the market) or “head in the sand” approach (fall victim to analysis paralysis and avoid choosing any tools) are no longer viable. But here’s the thing: a tool is not a strategy. The anatomy of a marketing tech stack [with recommended tools].
You can get the answers you need simply from product management analyticstools. To help you know which tool to use, this article will cover the ten best product analyticstools. TL;DR Product analyticstools analyze user interaction, preferences, and engagement with a product.
Landing pages can be set up with no cost or hassle with a tool like Squarespace or Wix. Once your landing page is live, you can start collecting leads, offer a preview of your app press and early adopters, and integrate with an analytics or A/B testing tool to test variations of your messaging strategy.
Looking for a Google Analytics alternative that offers better customization, improved product analytics , and more data accuracy? TL;DR Google Analytics is an analytics platform offered by Google that helps businesses track website or app performance. Limited data control and ownership.
They need to report upward, so you’re going through the motions, updating them on the work you’ve done, are doing, and intend to do. The roadmap is simply a conversation piece that, coupled with other communication tools, can help you achieve the ultimate goal: aligning stakeholders. And yet, you still need a product roadmap.
Funnel reports are a popular analyticstool used to optimize customer journeys and user flows. Our guide explains how to build and analyze funnel reports for actionable insights. To create funnel reports in Userpilot , you first need to define the conversion events. Let’s get to it! Book the demo!
What are the best product analyticstools that PMs can use to gather product insights ? Well, this depends on your product, how established your SaaS business is, and what kind of insights you need. In the blog, we look at 4 well-known product analyticstools, their pros, cons, and most suitable applications.
We organize all of the trending information in your field so you don't have to. Join 96,000+ users and stay up to date on the latest articles your peers are reading.
You know about us, now we want to get to know you!
Let's personalize your content
Let's get even more personalized
We recognize your account from another site in our network, please click 'Send Email' below to continue with verifying your account and setting a password.


Let's personalize your content