This site uses cookies to improve your experience. To help us insure we adhere to various privacy regulations, please select your country/region of residence. If you do not select a country, we will assume you are from the United States. Select your Cookie Settings or view our Privacy Policy and Terms of Use.
Cookie Settings
Cookies and similar technologies are used on this website for proper function of the website, for tracking performance analytics and for marketing purposes. We and some of our third-party providers may use cookie data for various purposes. Please review the cookie settings below and choose your preference.
Used for the proper function of the website
Used for monitoring website traffic and interactions
Cookie Settings
Cookies and similar technologies are used on this website for proper function of the website, for tracking performance analytics and for marketing purposes. We and some of our third-party providers may use cookie data for various purposes. Please review the cookie settings below and choose your preference.
Strictly Necessary: Used for the proper function of the website
Performance/Analytics: Used for monitoring website traffic and interactions
Without effective UX analytics that goes beyond collecting data, you’re losing valuable customers. Unfortunately, the research backs this up, with a staggering 90% of usersreporting that they stopped using an app due to poor performance. Basically, anything that ruins the userexperience.
Think of Net Promoter Score (NPS) software as a tool to measure your customers’ feelings about your product, and categorize them based on their level of loyalty (promoters, neutrals, and detractors). The great advantage of these tools is that they streamline the creation, distribution, and analysis of NPS surveys.
Using a custom ChatGPT model combined with collaborative team workshops, product teams can rapidly move from initial customer insights to validated prototypes while incorporating strategic foresight and market analysis. Instead of focusing solely on today’s customer problems, product teams need to look 2-5 years into the future.
While “use data to drive decision-making” sounds obvious, there’s a HUGE gap between saying it and doing it well. So, how do you get started with product analytics ? In this article, we’ll talk about: What product analytics is and why you need a solid strategy. What is product analytics?
Think your customers will pay more for datavisualizations in your application? But today, dashboards and visualizations have become table stakes. Discover which features will differentiate your application and maximize the ROI of your embedded analytics. Brought to you by Logi Analytics.
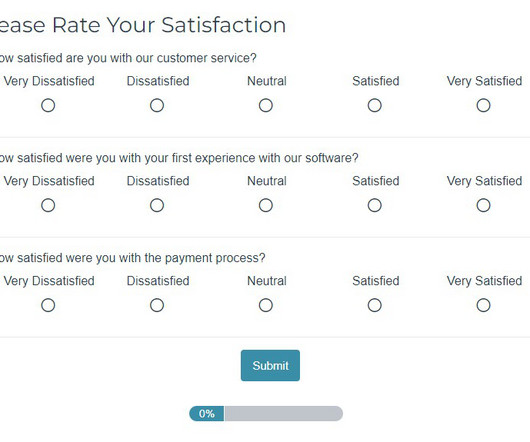
Introduction to customer satisfaction surveys Customer satisfaction surveys are vital tools for understanding what customers think, feel, and experience. Surveys provide a range of insights, from quick feedback after a purchase to in-depth assessments of brand loyalty. Don’t worry, we’ve got you.
You can gather all the user feedback or behavioral data you want or even generate tons of Google Analyticsreports. Despite all these efforts, you’re probably still not acting on product analytics correctly. Why actionable product analytics are important. This causes siloed data and integration issues.
Jack brings 20 years of experience managing innovation projects at companies like Sony Ericsson and Logitech. He shares practical insights from the Product Development and Management Association (PDMA) framework and explains how product managers can use these principles to improve their product development process.
When your company adopts multiple SaaS solutions to drive productivity, you unknowingly create a perfect storm for data fragmentation. Your customer information lives in Salesforce, while your support tickets are in Zendesk, your product usage data in Mixpanel, and your marketing campaigns in HubSpot. Sound familiar?
Speaker: Jay Allardyce, Deepak Vittal, Terrence Sheflin, and Mahyar Ghasemali
As we look ahead to 2025, business intelligence and dataanalytics are set to play pivotal roles in shaping success. Understanding these trends is not only essential to staying ahead of the curve, but critical for those striving to remain competitive and innovative in an increasingly data-driven world.
You know your product collects tons of data. Datavisualizationtools help turn your messy spreadsheets into clear, interactive insights. The best ones dont even need SQL or data science skills. Because product analytics should be easy and accessible for everyone, not just data experts.
Reveal Embedded Analytics For product owners, leveraging data is not just an advantageits a necessity. Product analytics empowers you to understand gaps in your offering and how users engage with your product. Both embedded analytics and product analytics are designed to help product owners in diverse ways.
You see, although we work hard to make Userpilot the best product adoption tool on the market, we know it isnt the perfect fit for every business. You get something that truly works for you, and we get to connect with people who value what we offer and have the potential to become power users (and sources of sustainable revenue!).
Drawing from his 20+ years of technology experience and extensive research, Nishant shared insights about how these activities vary across different organizational contexts – from startups to enterprises, B2B to B2C, and Agile to Waterfall environments.
Note that Ive decided not to state the names of the tools I found, partly as the AI landscape is changing rapidly and partly as you should research and select the tools that work best in your context rather than trusting my judgment. [2] 2] Market Research AI-based tools can discover user and customer trends using predictiveanalytics.
It’s what you do with the behavior data your app collects. And by behavior data, I dont mean installs (thats the easy part). I mean what happens after the download: how users navigate, what features they engage with, and where they drop off. Why track in-app user behavior? Whereas a power user is active daily.
How Rumi Cosmetiques Boosted UserExperience and Conversion Rates in eCommerce: A Case Study for Marketers andManagers Discover how Rumi Cosmetiques achieved a 75% increase in cart adds and doubled conversion rates by enhancing userexperience and conversion rate in eCommerce.
Case Study: Improving Data-Driven Decision Making for CSR Leadership Civian is a data-driven platform designed to help businesses measure, optimize, and showcase the social and economic impact of their investments in communities. Feature Engagement Users most frequently gravitated toward the map to explore and compare data.
Reveal Embedded AnalyticsData-driven companies have a hidden advantage! Theyve consistently outperformed their counterparts, reporting significantly higher metrics across operational efficiency (81% vs. 58%) , revenue growth (77% vs. 61%), and employee satisfaction (68% vs. 39%). How is this possible?
Wouldn’t it be great to see all user interactions with your product as they happen? Think about all the insights you could gather to improve the userexperience. Session recordings vs. heatmaps While both heatmaps and session recordings shed light on user interactions, they provide different insights.
Are you struggling to make sense of scattered userdata? The right customer analytics platform helps you uncover exactly how customers interact with your product: so you can spot issues early, optimize user journeys, and drive sustainable growth. Pendo – the best software for product-led insights.
The choice is tough because there’s no single tool that covers all use cases. What’s worse, you will find multiple tools in each category, making it incredibly difficult to pick the tool that satisfies your needs and offers the best value for money. Which product feedback software should you choose for your SaaS?
Ever feel like you’re missing a piece of the puzzle when it comes to understanding your users? You have the analyticsdata, but it doesn’t tell the whole story. You know what users are doing, but not why. This powerful tool allows you to see your website or web app through your users’ eyes.
When users interact more, it may seem like a win. However, without qualitative feedback and behavioral insights, teams risk misreading signals, leading to frustration and churn. Numbers alone can be misleading higher engagement doesnt always mean user satisfaction. Key differences between data types.
Reveal Embedded Analytics This update is packed with customization, usability, and performance improvements to help you build seamless, high-impact analyticsexperiences faster. Fixed Lines for Charts: Set static reference points to highlight key datatrends. Build on-brand, scalable analytics today.
Similarly, service designers are trained to navigate through complex systems of an environment/ situation by leveraging their system thinking capabilities. For instance, in the case of pension services, there might be financial advisors, pension administrators, and customer service agents involved. Let deep dive into 4 Ps.
In a fast-paced industry like SaaS, leveraging business analytics effectively can be the key to staying competitive and driving product growth. Business analytics offers invaluable insights that help SaaS companies optimize operations, enhance customer experiences, and make data-driven decisions.
If there is one thing thats altering the way we create userexperience (UX) designs and conduct research in 2024, it is definitely artificial intelligence (AI). Well start with an overview and explore how AI can take on tasks such as analyzing userdata and automated prototyping to help professionals connect with users on a humanlevel.
And Im not talking about pretty visuals for the sake of it. I mean frictionless, user-obsessed, data-driven design choices that guide your customer from just browsing to Add to Cart without ahiccup. The secret often lies in the art of UserExperience design. So, what exactly is a conversion funnel ?
The most successful brands use behavioral analytics to help their marketing, customer service, product, and operations teams drive incredible ROI for their companies. To understand what behavioral analytics is, we have to discuss behavior data. What is behavioral data? What is behavioral analytics?
Unfortunately, that technology isn’t here yet, so UX research tools are the next best thing. These tools can provide you with the qualitative and quantitative data you need to understand how your customer behaves in your product, so you can make the necessary changes to improve their experience.
If so, you need to invest in the right customer insighttools. These tools are perfect for providing valuable customer insights to make product improvements and optimize your customer experience. Amplitude offers deep user interaction insights and advanced analytics to enhance customer engagement.
Userexperience can make or break a web app. If your software is slow or buggy, users wont stick around for long. If youre only finding out about these issues after users complain, youre already too late. On top of that, Userpilot also offers in-app engagement tools you can use to act on the collected data.
A self-servicedata platform is the backbone of informed decision-making and a growing SaaS business. But how do you choose the right data platform for product analytics ? Let’s go over what a data platform is, its importance, and the must-have features you should consider to choose the right platform for you.
Explore the secrets of creating a successful Crypto Prediction and Opinion Platform, and provide users with insights to help them navigate the cryptocurrency market wisely. Crypto prediction platforms provide valuable insights into the volatile world of cryptocurrency markets, aiding users in making informed decisions.
What happens when you build a product or service around what you think potential customers want, only for them to buy something else? It could include conducting user interviews and surveys, analyzing product usage data, and tracking customer feedback , to name a few.
Quantitative data alone doesn’t reveal intent, only outcomes. Thats why you need user session analysis. By combining contextual insights from session replays , heatmaps, and behavior analytics, user session analysis helps you interpret metrics through the lens of real user journeys.
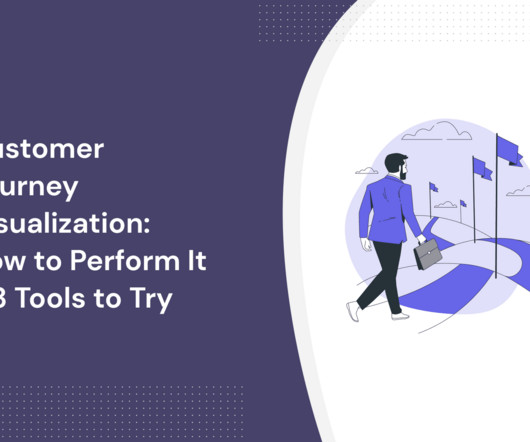
Want to conduct customer journey visualization but not sure what’s the best way to do it? This article shows you a step-by-step process for collecting customer data and creating easy-to-understand visual maps. TL;DR A customer journey map represents the steps users take when interacting with your brand.
What began as an overwhelming experience, trying to grasp concepts and frameworks, has now turned into a passion project that Im eager to share with you. In just six months, I transitioned from being a complete beginner to confidently speaking at conferences, sharing insights about AI and its impact on business and design.
Make better-informed business decisions Data-driven insights from CX metrics enable teams to make informed decisions. Understanding your current customer experience helps prioritize the right things that matter to your customers. This applies to product development, marketing strategies, and customer service enhancements.
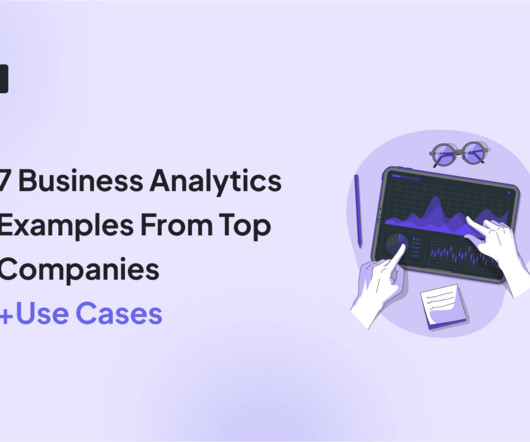
Data-driven companies are 58% more likely to hit revenue goals. This shows how important business analytics is for your product. Business analytics gives insights that help you make better decisions to improve your product. This article will show seven examples of business analytics to highlight its positive impact.
Whatfix Mobile is a Digital Adoption Platform (DAP) specifically designed to enhance the experience for users of native Android and iOS apps. Whatfix delivers context-aware guidance that helps users correctly complete sensitive tasks like handling patient documents, uploading payroll data, etc., moment faster.
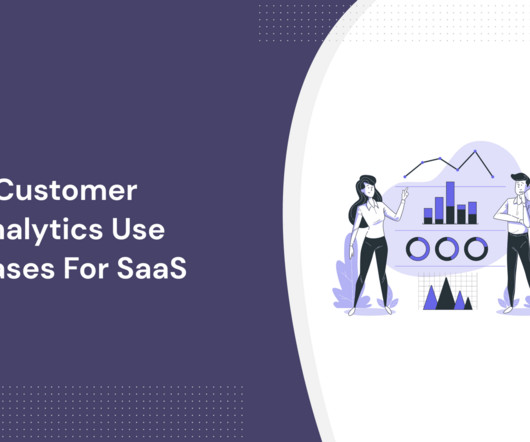
Looking for customer analytics use cases that can significantly improve your SaaS? We also cover: Customer analytics categories. The three types of customer analytics and their significance. How to measure customer behavior with dataanalytics. There are four categories of customer analytics categories.
Would you like to learn how to design a SaaS metrics dashboard for your team without any coding? In the article, you will find examples of various SaaS dashboards and learn how to create them with Userpilot analytics. We also explain what metrics you may want to track and how to use the insights they offer.
We organize all of the trending information in your field so you don't have to. Join 96,000+ users and stay up to date on the latest articles your peers are reading.
You know about us, now we want to get to know you!
Let's personalize your content
Let's get even more personalized
We recognize your account from another site in our network, please click 'Send Email' below to continue with verifying your account and setting a password.


Let's personalize your content