This site uses cookies to improve your experience. To help us insure we adhere to various privacy regulations, please select your country/region of residence. If you do not select a country, we will assume you are from the United States. Select your Cookie Settings or view our Privacy Policy and Terms of Use.
Cookie Settings
Cookies and similar technologies are used on this website for proper function of the website, for tracking performance analytics and for marketing purposes. We and some of our third-party providers may use cookie data for various purposes. Please review the cookie settings below and choose your preference.
Used for the proper function of the website
Used for monitoring website traffic and interactions
Cookie Settings
Cookies and similar technologies are used on this website for proper function of the website, for tracking performance analytics and for marketing purposes. We and some of our third-party providers may use cookie data for various purposes. Please review the cookie settings below and choose your preference.
Strictly Necessary: Used for the proper function of the website
Performance/Analytics: Used for monitoring website traffic and interactions
Known as the Martech 5000 — nicknamed after the 5,000 companies that were competing in the global marketing technology space in 2017, it’s said to be the most frequently shared slide of all time. The reasons for this growth – high-velocity economics of software innovation, the migration of money from old media to new media, etc.
With companies relying entirely on data, it’s common sense to carry out SaaS reporting. The different reports can offer a variety of insights that help manage your product in the right direction. You just need to ensure you can get started correctly and the metrics you should report on to get the critical metrics.
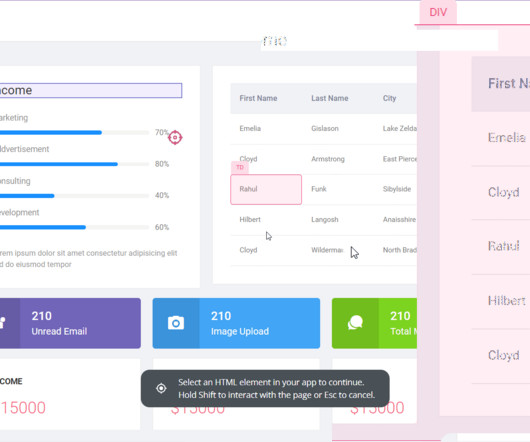
As you’re researching dashboard reportingtools, you’ve probably noticed how hard it is to find reliable information on the available solutions. When choosing a dashboard tool, pay attention to the ease of use , customization, integrations , value, and data privacy to meet business needs effectively. Let’s dive in!
Data visualization tools help turn your messy spreadsheets into clear, interactive insights. So where do you find the right tools? In this guide, well break down the top data visualization tools for product teams, so you can stop guessing and start making smarter, data-driven decisions. What are data visualization tools?
Speaker: Sam Owens, Product Management Lead, Namely Platform
Sam and Jessica faced a problem that many product managers face: their customers wanted better analytics and reporting, but analytics wasn’t the core function of the SaaS product Sam and Jessica manage. Evaluated their options for building a solution themselves or buying something.
In this, we’ll explore more benefits of self-serve product analytics and also introduce you to the tools that help you implement this system in your company. TL;DR Self-service analytics is a business intelligence (BI) approach that empowers users to access, analyze, and interpret data without relying on IT or data teams.
G2 has named Indicative as a Leader in Customer Journey Analytics in G2’s 2020 Summer Report. . Indicative is the only Customer Analytics platform designed specifically for non-technical business users that connects directly to your data warehouse. Here is what some of our customers had to say: “Great tool for funnel analysis.”
It empowers each team across the organization to make data-driven decisions, with access to reporting and ad hoc analysis. . What Technology Do You Need in Your Stack? As technology develops, analytics stacks become easier to set up, manage, and scale. The data and analytics space is rapidly growing, expanding, and evolving.
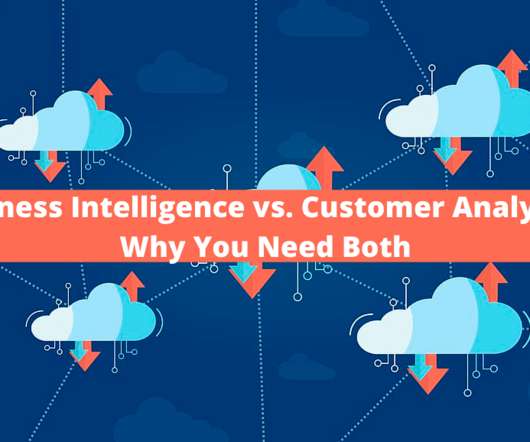
Focused on democratizing access to data-driven decision making, Customer Analytics tools empower non-technical users (like marketing and product teams) to make sense of all the data. How Customer Analytics tools fit into the broader BI and analytics landscape. Have a look at some of the platform’s key strengths and weaknesses.
Speaker: Eric Feinstein, Professional Services Manager, Looker
For a long time, Product Managers have found it challenging to design interfaces inside their products that users could use for reporting. It seems like PMs and engineers have grown to hate embedded reporting. How to evaluate embedded analytic solutions as strategy to greatly reduce initial and on-going engineering effort.
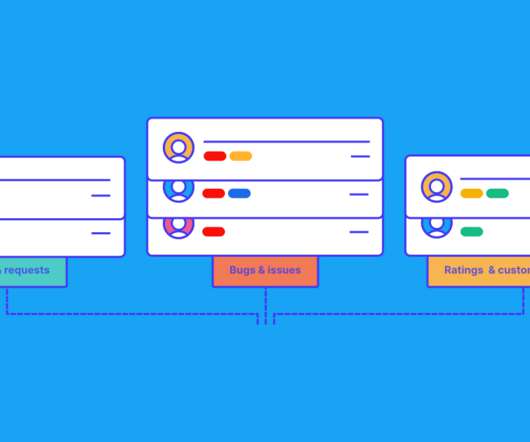
Key Tasks User issues reports. Bug Service Level Agreement (SLA). Bug Service Level Agreement (SLA). Conduct product parity audits across platforms to identify missing features; conduct log audits to identify areas where you can add logging to speed issue resolution. Product health tracking. Bug triage. Product audits.
Choosing the right embedded analytics platform for your business needs is paramount. With its robust capabilities to expand your business, add value to your customers, and ultimately grow your profits, embedded analytics solutions are becoming essential for businesses that want to be able to survive in the market.
This is where tools such as Reveal and Looker come in handy – they convert raw data into easy-to-understand and easy-to-use insights that enable organizations to reshape and modernize the way they do business. What is Looker? What Is Looker? Reveal VS Looker – Comparing Features & Functionalities.
In 2019, industry-leading Business Intelligence tools (BI tools), Looker and Tableau, were acquired by Google and Salesforce for over $18 billion combined. These massive deals show that BI tools and data warehouses are a powerful combo that companies across the globe are incorporating into their tech stacks.
Tracking cross-platform analytics is essential for product teams to see a complete view of customer behavior. TL;DR Cross-platform analytics is the activity of tracking and analyzing user behavior across multiple platforms or devices. Tools like Google Analytics or Amplitude allow you to track user behavior across all platforms.
While a bachelor’s degree in a relevant field like computer science, information systems, or statistics is often preferred, it’s not always a strict requirement. Userpilot is an all-in-one product platform with engagement features and powerful analytics capabilities. Book a demo to see it in action!
So, we rely on software, spreadsheets, and statistical packages to make our best judgment calls. In this article, you’ll learn about a new genre of customer analytics capabilities that speak the language of people, rather than systems. If you use Looker, for instance, you probably rely on this platform’s data capabilities.
Are you looking for Zendesk integrations to boost the efficiency of your self-service customer support? The article explores the best Zendesk integrations for: Customer support Customer feedback Productivity Email and social media communication Analytics and reporting Let's get right to it! If so, you’re in the right place!
Our data scientists and analysts—with over 40 years of combined experience at companies including Zoom, Meta, Reddit, Twitter, and Google—require powerful and sophisticated tooling for business operation and revenue data analysis. Up until now, that was handled by Mixpanel and Looker, our BI (business intelligence) solution of choice.
From understanding the analytics landscape to mapping capabilities with KPIs and integrating new tools with your current stack, we know that choosing a product analytics solution can be overwhelming—not to mention, time-consuming. How is Mixpanel different from marketing analytics tools like Google Analytics?
While a bachelor’s degree in a relevant field like computer science, information systems, or statistics is often preferred, it’s not always a strict requirement. Looking into tools for business intelligence analysts? Userpilot is an all-in-one product platform with engagement features and powerful analytics capabilities.
Here are some essential tools: Best tool for feedback collection and product analytics – Userpilot : A no-code tool, Userpilot lets customer insight managers trigger in-app surveys, conduct funnel and path reports, and visualize data on custom dashboards that are easily sharable with stakeholders.
Among all embedded analytics products on the market, Tableau is certainly one of the most popular BI tools for analyzing, visualizing, and working with data. But like any other softwaresolution on the market, Tableau is also not perfect and surely not the best fit for every business use case.
Ever found yourself getting loads of feedback, but didn’t have the customer feedback system in place to do something with it all? This is why when you’ve got a rock-solid customer feedback system in place, you’re ready to meet customer expectations. The customer feedback system learning.
To quickly summarize, we collect marketing, sales, and product data from the relevant systems of record, merge them together in BigQuery using Salesforce account IDs as a common identifier and tag each account with whether it belongs to our ideal customer profile (ICP). There are two reasons.
Let’s start, Google Analytics 4 is a powerful web analytics service that provides valuable insights into user behavior, engagement, website conversion, and much more. Exploration Reports : GA4 offers exploration reports for advanced and customized data analysis, giving you deeper insights into user behavior. It’s six years old.
Lead Product Analyst : A lead product manager leads the product analysis efforts and monitors the research, analysis, reporting , and strategy development. Best tools for product analysts Best tool for Product Analysis ( Userpilot ) : Userpilot gives you insight into your product performance and helps you understand user behavior.
Whether you’re looking to deepen your expertise, stay updated with industry trends, or find practical tools to enhance your workflow, the right resources are essential for continuous growth and success. They provide recommendations for product development , marketing strategies, resource allocation, or customer service improvements.
Today, about one-third of Americans have used a dating app or site, and 12% have either been in a committed relationship or gotten married to someone they met through online dating, according to a recent Pew Research report. I’ve been with OkCupid for three years and I manage our data science team, which handles platform analytics.
Your users are not going to log into your staging environment to use your software, so why do companies use dummy environments to test their features before release? The answer is that it’s just been the status quo for so long in software development. The Benefits of Testing in Production. The First 30 Days. Days 30-60.
Then, when Product wanted to validate a particular user problem, we’d start by gathering relevant quantitative and qualitative data from our product instrumentation such as MixPanel or Looker, followed by reaching out to specific instructors or students early in the process. We wrote simple scripts and practiced walk-throughs.
You can collect customer feedback in a variety of ways: Messenger tools Social media Email. You can easily write out a generic understanding of what you see in your customer feedback software. That’s why we recommend proper tools that help you receive specific and actionable insights. Better products and services.
For marketing teams focused on getting more user traffic and signups, Google Analytics has been the tool of choice. Mixpanel has long been the most powerful and easy-to-use event analytics tool to help you understand customer behavior so you can build better user experiences and drive higher conversions. How does this compare to GA4?
This entire episode is brought to you by Jira Product Discovery —Atlassian’s new prioritization and roadmapping tool built for product teams — Melissa Perri is the CEO of Produx Labs, a product management training organization; author of the seminal PM book The Build Trap ; and a former Harvard Business School professor of product (..)
An analyst or analytics engineer is responsible for modeling the data and will care about its structure, and you might have several teams responsible for building reports and analysing the data in several tools (e.g. Looker and Mixpanel). Software Engineer. Roland Meyer. A reminder - good PMs don’t need to know SQL.
Time and again, folks have used product analytics tools to better understand their customers. With a tool like Amplitude or Mixpanel, you can easily answer the above questions and much more. You can use tools like Chameleon , Appcues , or Pendo to get started easily. ?? What does our retention curves look like?
Where does product analytics fit in the realm of analytics tools on the market? Hint: Skip to 3:45 to learn how Amplitude compares to BI tools and marketing analytics.). Because Amplitude as a company, we think we are really the only analytics platform that’s built ground up to help producting succeed. I need to be on the web.
Where does product analytics fit in the realm of analytics tools on the market? Hint: Skip to 3:45 to learn how Amplitude compares to BI tools and marketing analytics.). How Amplitude differs from BI tools and marketing analytics (and other questions) Click To Tweet. You can find a full transcript below.
Subscribe now For more: Lennybot | Podcast | Swag | Hire your next product leader | My favorite courses I’ve always been fascinated by what tools people choose to use in their work. ” we asked people what tools they most love, what tools frustrate them, and what they’d change if they could. 5% use Bolt.
A shift from the on-premise legacy systems, it aimed to provide a faster, scalable, and more cost-effective way 0f storing and analyzing data. They think a modern data stack only requires combining multiple tools and systems to handle data processing. It's just upgraded tools leading to the same data complexities and silos.
We organize all of the trending information in your field so you don't have to. Join 96,000+ users and stay up to date on the latest articles your peers are reading.
You know about us, now we want to get to know you!
Let's personalize your content
Let's get even more personalized
We recognize your account from another site in our network, please click 'Send Email' below to continue with verifying your account and setting a password.


Let's personalize your content