Remove 2017 Remove Data Visualization Remove Product Manager Remove Research Software
article thumbnail

Food & Drink Apps: Using Industry Benchmark Data to Understand Changes in Mobile Customer Sentiment

Alchemer Mobile

Mobile apps in the Food and Drink category have experienced radical change these last few weeks. The COVID-19 pandemic has more and more people using app-based food delivery services, and QSRs are seeing an influx of mobile payments at their drive-throughs with the closure of dine-in establishments. Why is sentiment changing?

article thumbnail

What Do Industry Analysts Think About Software Analytics?

Revulytics

It is no surprise that we talk a lot about software usage analytics , but I thought it would be interesting to take a look and see what industry analysts are saying, too. What is driving this interest in product usage and data analytics? What is driving this interest in product usage and data analytics?

Insiders

Sign Up for our Newsletter

This site is protected by reCAPTCHA and the Google Privacy Policy and Terms of Service apply.

article thumbnail

Telerik Retiring: Alternatives and Next Steps for Software Usage Analytics Customers

Revulytics

The Telerik Platform is retiring on May 10, 2018 (“retiring products that have served their purpose”). This leaves users of Telerik Analytics (formerly EQATEC Analytics) in a bit of a jam as they seek an alternative software usage analytics platform. Platform Support and Easy Integration You Need.

article thumbnail

Media Apps: 2020 Mobile Customer Engagement Benchmarks

Alchemer Mobile

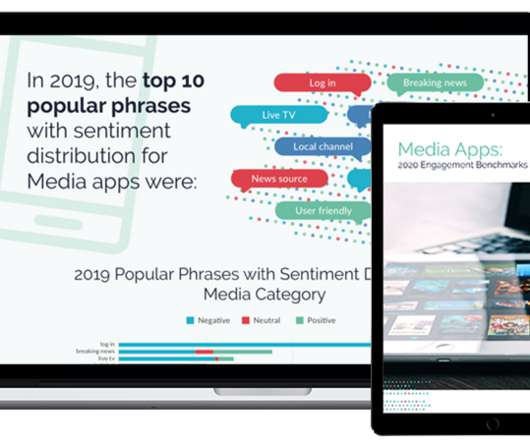
Mobile apps in the Media category have experienced an uptick in traffic these past few weeks and months as people scramble to get their hands on the latest news regarding coronavirus. Why is your app rating decreasing? Download the 2020 Mobile App Engagement Benchmark Report for Media Apps.

article thumbnail

Mobile Customer Response Rates Grew by 20% Last Year: New Data from our 2018 Benchmark Report

Alchemer Mobile

They need to be able to understand the analytics behind customer interaction and response rates so they can make data-driven decisions. While this is only an overall increase of 1 percentage point from 2017, the response rate in 2018 was phenomenal at 91%. That’s 20% growth year-over-year. Wrapping it up.

article thumbnail

Customer Retention Analytics – The Ultimate Guide

Userpilot

How much does your business stand to gain from using customer retention analytics? Considering that retaining customers (and reducing churn ) costs a fraction of acquiring new ones , analyzing what makes customers stay or go is important for any SaaS business. What is customer retention analytics?

article thumbnail

How I treat creative copy like a product—using data

Mixpanel

It’s absolutely rooted in the empirical data that gives an objective understanding of your customers’ paint points and desires. It’s a product unto itself. And just like a product process, you need data to create something great. From customer research to monitoring and iteration, good copywriting is rooted in data.