This site uses cookies to improve your experience. To help us insure we adhere to various privacy regulations, please select your country/region of residence. If you do not select a country, we will assume you are from the United States. Select your Cookie Settings or view our Privacy Policy and Terms of Use.
Cookie Settings
Cookies and similar technologies are used on this website for proper function of the website, for tracking performance analytics and for marketing purposes. We and some of our third-party providers may use cookie data for various purposes. Please review the cookie settings below and choose your preference.
Used for the proper function of the website
Used for monitoring website traffic and interactions
Cookie Settings
Cookies and similar technologies are used on this website for proper function of the website, for tracking performance analytics and for marketing purposes. We and some of our third-party providers may use cookie data for various purposes. Please review the cookie settings below and choose your preference.
Strictly Necessary: Used for the proper function of the website
Performance/Analytics: Used for monitoring website traffic and interactions
Most product teams get mobile appanalytics wrong. They track 47 different key performance indicators (KPIs) in their mobile analyticsplatform , spend hours debating dashboard numbers, yet can’t predict which users will churn next week The problem here isn’t a lack of data.
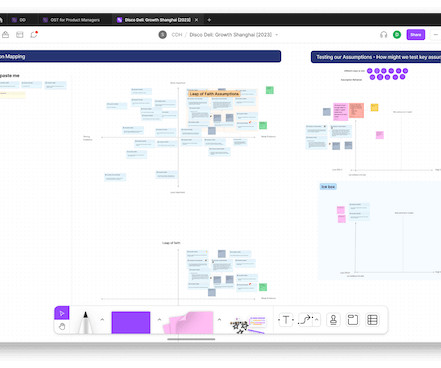
The opportunity solution tree helps visualize all the work that goes into continuous discovery. And while opportunity solution trees have become increasingly common among product teams, there’s still plenty of room for customization, both in the way you set up your trees and the tools you use to build them.
Featuring an engaging discussion with Inis Hormann (Marketing Director Germany, Cepheid) and Steve Kury (Leadership Development Consultant, SHK Leadership Consulting), the session provided actionable insights for PMs at every level. Leverage Data: Use findings to guide decisions, reduce uncertainty, and inform future product iterations.
Be Consistent Across Platforms Your brand should be cohesive across various channels—whether it’s your LinkedIn profile, industry blogs, or internal communications. For example, if your brand centers around being a data-driven decision-maker, ensure that your communications emphasize this.
Embedding dashboards, reports and analytics in your application presents unique opportunities and poses unique challenges. We interviewed 16 experts across business intelligence, UI/UX, security and more to find out what it takes to build an application with analytics at its core.
You see, although we work hard to make Userpilot the best product adoption tool on the market, we know it isnt the perfect fit for every business. A quick look into Userpilot In a nutshell, Userpilot is an all-in-one product growth platform that enables businesses to increase product metrics at every stage of the user journey.
You know your product collects tons of data. Datavisualizationtools help turn your messy spreadsheets into clear, interactive insights. The best ones dont even need SQL or data science skills. Because product analytics should be easy and accessible for everyone, not just data experts.
Data can be a powerful tool if you know how to put it to work! Often I start my analytics conference keynote addresses by asking the audience to share the issues they face in their organizations. In fact, this issue is so pervasive in organizations that 80 to 90% of the analysts in the audience report this problem.
Tracking user behavior analytics in mobile apps is a whole different challenge compared to the web. Without a global DOM or easy auto-capture tools, tracking mobile app user behavior takes more planning. And the behavioral data you do collect depends on what you choose to track and how you track it. Not so much.
Organizations look to embedded analytics to provide greater self-service for users, introduce AI capabilities, offer better insight into data, and provide customizable dashboards that presentdata in a visually pleasing, easy-to-access format.
Note that Ive decided not to state the names of the tools I found, partly as the AI landscape is changing rapidly and partly as you should research and select the tools that work best in your context rather than trusting my judgment. [2] 2] Market Research AI-based tools can discover user and customer trends using predictiveanalytics.
As you’re researching dashboardreportingtools, you’ve probably noticed how hard it is to find reliable information on the available solutions. TL;DR Dashboards display critical business data in real-time, streamlining decision-making and focusing on key metrics. Let’s dive in!
Are you tracking SaaS metrics without knowing how to make the analytics process easier? Analyticsdashboards are visualizationtools that give you an overview of key metrics. This makes it much easier to extract insights from your analysis compared to looking at mere numbers.
Reveal Embedded AnalyticsData-driven companies have a hidden advantage! Theyve consistently outperformed their counterparts, reporting significantly higher metrics across operational efficiency (81% vs. 58%) , revenue growth (77% vs. 61%), and employee satisfaction (68% vs. 39%). How is this possible?
Speaker: Dean Yao, Director of Marketing at Jinfonet
What's the next big trend in analyticssoftware and applications? You've probably used it without even knowing: embedded reporting and analytics. They also want to provide what their users ask for: reporting and analytics from within the context of the applications they are already using.
When it comes to continuous discovery , there’s no such thing as “the perfect tool.” Instead of seeking the best tool out there, it’s much more effective to look for the best tool for your team. Teresa often says, “The best tool is the one that your team will use.” Today, we’re taking a slightly different approach.
An interactive demo is a self-guided walkthrough that uses tooltips, modals, hotspots, and other interactive elements to help users quickly explore your SaaS product. Why build interactive demos for your SaaS product? What is an interactive product demo? This results in faster Aha!
You can get the answers you need simply from product management analyticstools. To help you know which tool to use, this article will cover the ten best product analyticstools. TL;DR Product analyticstools analyze user interaction, preferences, and engagement with a product.
Analyticstools offer a competitive advantage for companies investing in prolonged product growth. However, not all companies can invest precious resources in an analyticstool. In reality, some companies are better served using free vs paid analyticsplatforms. There are different types of analyticstools.
Speaker: speakers from Verizon, Snowflake, Affinity Federal Credit Union, EverQuote, and AtScale
Join this webinar panel for practical advice on how to build and foster a data literate, self-service analysis culture at scale using a semantic layer. In this webinar you will learn about: Making data accessible to everyone in your organization with their favorite tools.
Today, almost any SaaSplatform offers a reporting or insights module. A little investigative research on G2 uncovered the top 5 analytics UX mistakes made by SaaS vendors. Here are the top complaints distilled from 4,600 G2 product reviews of 140 top SaaS vendors. What do they like?
By analyzing user behavior patterns and uncovering valuable insights, behavior analyticstools enable businesses to design strategies that drive retention and business growth. Discover the cutting-edge of behavioral analyticstools! There are different types of behavioral analyticstools used in SaaS.
No product tool or template can save you if you’re not killing it in these three areas. That’s why we’ve listed 12 tools that the best product managers use to do their jobs better? and not the best product management tools. You can’t use them to present to stakeholders, and they’re a nightmare for collaboration.
From new UX-related technologies and automation to personalization. Well start with an overview and explore how AI can take on tasks such as analyzing user data and automated prototyping to help professionals connect with users on a humanlevel. This fast-paced testing accelerates design cycles and helps refine products in lesstime.
Speaker: Laura Klein, Principal at Users Know and Author of UX for Lean Startups
That's why Laura Klein, product manager and UX designer, has a set of tips to help application teams improve their embedded dashboards and reports. How to avoid common mistakes people make when presentingdata. And yet we have so many of them in our lives. October 25, 2018 12:30 PM PST, 3:30 PM EST, 8:30 PM GMT
As you’re researching customer analyticsplatforms, you’ve probably noticed how hard it is to find reliable information on the available solutions. TL;DR Customer analyticsplatforms are specialized tools that allow you to collect and analyze data. Let’s dive in! Prices available upon request.)
When Jane, a seasoned product manager, started her new role at a fast-growing SaaS company, she was ready to make an impact. Pro Tip: Pair your quick wins with data. A dashboard showing metrics like feature adoption or user engagement amplifies your credibility. It shows youre thoughtful, analytical, and focused on results.
Tali Melchior , Director of Product Management at Texthelp , was first inspired to experiment with opportunity solution trees in a previous role. Then when Tali moved to her current position, she brought her opportunity solution tree knowledge along and adapted it to the new setting. You can submit your story here.
Thanks to the abundance of tools out there, marketing has never been easier. In this article, we examine some tools that can help your SaaS team to drive product growth. We will also consider valuable examples of tools that can inspire your process. The best examples are Userpilot , Hotjar , and Google Analytics.
A self-servicedataplatform is the backbone of informed decision-making and a growing SaaS business. But how do you choose the right dataplatform for product analytics ? What should you look for?
Visualdata surrounds us – colorful charts on weather reports, infographics on the web and in social media articles, map charts in presentations, etc. To help you get started with datavisualization, this article explores various visualization methods and their use cases. Funnel charts.
90% of the world’s data has been created in the past 2 years, and businesses spend more than $180 billion annually on big dataanalytics. Since our first ancestors began writing on parchment, data has been an integral part of the human experience. What is big dataanalytics? But how is it used?
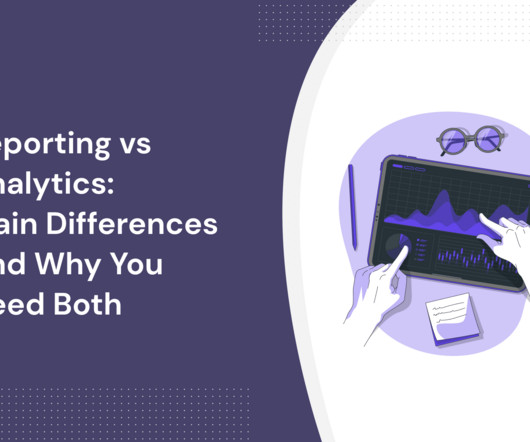
Reporting vs. analytics – which should you choose for your business? While a growing number of businesses are increasingly adopting reporting and analytics , the difference between both terms can be confusing. Essentially, reports communicate information, while analytics provide context and insight.
When you think of Whatfix, your mind probably goes to a digital adoption or an employee onboarding platform. But for mobile, youd want to invest in a solution that truly gets the job done, aka one that improves user engagement and retention. The question is: Can Whatfix mobile give you what youre looking for? moment faster.
And Im not talking about pretty visuals for the sake of it. I mean frictionless, user-obsessed, data-driven design choices that guide your customer from just browsing to Add to Cart without ahiccup. In the bustling world of eCommerce, UX design isnt just a buzzword; its a strategic tool that can make or break your businesss success.
The reasons why Saas startups are recently making a huge wave to become the next trillion-dollar industry. Over the past years, investment in SaaS startups has been increasing steadily. Saas startups that provide software as a service have a good delivery model. The SaaS market has increased from $31.5
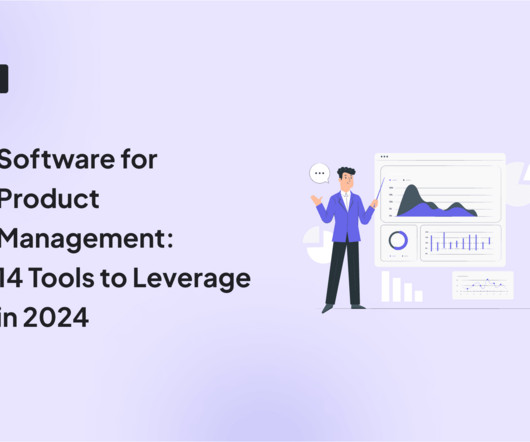
Using software for product management. This article will examine some of the best product management software in the market. TL;DR Choose a product management platform with advanced features, a user-friendly interface, customization, third-party integrations, scalable pricing, robust security , and collaboration features.
If you’re looking to present your hard work to stakeholders, justify a product decision, or check the health of your app, you’re in the right place. Learn about the importance of mobile app KPI dashboards and copy dashboards from real mobile app product managers, engineers and designers.
Since then, she’s helped grow the Udemy’s B2B SaaS arm to more than 5,000 enterprise customers, which include the likes of Pinterest, Adidas, and General Mills. You could take a course on how to play guitar, paint with watercolors, create a website, or build your own mobile app – all in one place.
How New Heuristics Are Reshaping the Creative Process Between Humans andMachines Image generated byChatGPT When the wave of generative AI tools began flooding the market, I must confess my reaction was mixed: a sense of fascination for the possibilities and concern for the ethical challenges looming on the horizon.
Looking for a Google Analytics alternative that offers better customization, improved product analytics , and more data accuracy? TL;DR Google Analytics is an analyticsplatform offered by Google that helps businesses track website or app performance. Limited data control and ownership.
When it comes to boosting your product growth, user tracking tools can make your life a lot easier. They offer insights into product performance , what your users are doing inside your product, and why they are doing it. But how do you know you’re picking the right tools? Amplitude is the best event-tracking software.
In SaaS, the top dataanalytics trends can either be a revolution or just fluff. So what are the trends in the dataanalytics landscape that are actually important for product management ?
Or rather, two – conversation topics and custom reports. Well, my panel today are no strangers to asking that same question in conversations they have with each other, as they have been instrumental in our recent release of custom reports and conversation topics. Opening new possibilities with custom reports. Thomas: Awesome.
We organize all of the trending information in your field so you don't have to. Join 96,000+ users and stay up to date on the latest articles your peers are reading.
You know about us, now we want to get to know you!
Let's personalize your content
Let's get even more personalized
We recognize your account from another site in our network, please click 'Send Email' below to continue with verifying your account and setting a password.


Let's personalize your content