This site uses cookies to improve your experience. To help us insure we adhere to various privacy regulations, please select your country/region of residence. If you do not select a country, we will assume you are from the United States. Select your Cookie Settings or view our Privacy Policy and Terms of Use.
Cookie Settings
Cookies and similar technologies are used on this website for proper function of the website, for tracking performance analytics and for marketing purposes. We and some of our third-party providers may use cookie data for various purposes. Please review the cookie settings below and choose your preference.
Used for the proper function of the website
Used for monitoring website traffic and interactions
Cookie Settings
Cookies and similar technologies are used on this website for proper function of the website, for tracking performance analytics and for marketing purposes. We and some of our third-party providers may use cookie data for various purposes. Please review the cookie settings below and choose your preference.
Strictly Necessary: Used for the proper function of the website
Performance/Analytics: Used for monitoring website traffic and interactions
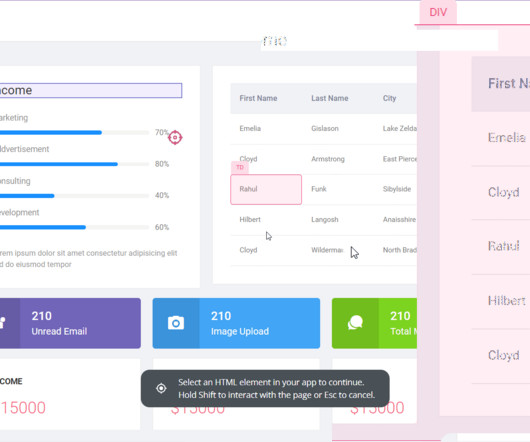
Cascade: UI Elements in Light Mode Templates and AI tools can help in spots, but they don’t feel your context or see every nuance. In the wrong hands, they can turn a helpful tool into a harmful one. Admin analytical dashboard for the fitness app Step 1. A tool for everyone usually helps no one.
Data visualization tools help turn your messy spreadsheets into clear, interactive insights. Because product analytics should be easy and accessible for everyone, not just data experts. So where do you find the right tools? What are data visualization tools? How do data visualization tools help product teams?
Subscribe now For more: Lennybot | Podcast | Swag | Hire your next product leader | My favorite courses I’ve always been fascinated by what tools people choose to use in their work. ” we asked people what tools they most love, what tools frustrate them, and what they’d change if they could. 5% use Bolt.
Analysts work on everything from marketing to engineering, product, and beyond. ✅ Verified : Celine Liu , Uber's former Global Analytics Lead, wrote this guide. Celine has conducted 100+ interviews across analytics, operations, and strategic roles. But what exactly does a data analyst do? What Does a Data Analyst Do?
Speaker: Richard Cheng, Associate Product Manager, Mark43
Tune in to this webinar to hear how Mark43 Product Manager Richard Cheng went about researching, prototyping, and iterating to deliver analytics and business intelligence tools to police departments, emergency call centers, and other public safety agencies, bringing Mark43 users a positive and effective product experience.
✅ Verified : Celine Liu , Uber's former Global Analytics Lead, wrote this guide. Celine has conducted 100+ interviews across analytics, operations, and strategic roles. Business Case Round: Assesses your analytical thinking and business acumen with open-ended scenarios. Which would you use and why?
🧠 Check out our complete data analytics interview prep course. Data-Driven Work Experience Each bullet starts with an action verb and showcases measurable achievements (e.g., " Developed an automated revenue reporting system, improving response time by 40% "). ✅ Passes the ATS (Applicant Tracking System) filters.
Known as the Martech 5000 — nicknamed after the 5,000 companies that were competing in the global marketingtechnology space in 2017, it’s said to be the most frequently shared slide of all time. The reasons for this growth – high-velocity economics of software innovation, the migration of money from old media to new media, etc.
What Google’s and Salesforce’s respective acquisition of Looker and Tableau Software means for CIO’s The BI analyticstool space is consolidating to compete against Microsoft’s ensemble of Business Analytics(BA) products which promises to solve for the entire workflow?—?data last week and Salesforce’s $15.3b
Every team — from product to marketing, and IT to engineering — is generating data. A strong analytics stack is foundational to being able to make sense of it all. Investing in a robust and efficient analytics stack is a necessity for a modern business in order to compete. What Technology Do You Need in Your Stack?
With companies relying entirely on data, it’s common sense to carry out SaaS reporting. TL;DR SaaS reporting helps to track key metrics and inform the right decisions backed up with data. TL;DR SaaS reporting helps to track key metrics and inform the right decisions backed up with data.
Tracking cross-platformanalytics is essential for product teams to see a complete view of customer behavior. TL;DR Cross-platformanalytics is the activity of tracking and analyzing user behavior across multiple platforms or devices. What is cross-platformanalytics?
Omnichannel analytics enable teams to get a 360 view of user behavior at different touchpoints of the customer journey. In particular, it covers: What omnichannel analytics are Why it’s important to track How to implement your omnichannel analytics strategy Omnichannel analyticstools Let’s get right into it!
As you’re researching dashboard reporting tools, you’ve probably noticed how hard it is to find reliable information on the available solutions. To make your life a little bit easier and help you choose the best dashboard analyticstool for your SaaS, we’ve produced a guide of 12 excellent platforms available on the market in 2024.
Experts predict the Customer Analyticsmarket will top $24 billion by 2025. That’s where Customer Analytics comes in. Focused on democratizing access to data-driven decision making, Customer Analyticstools empower non-technical users (like marketing and product teams) to make sense of all the data.
In 2019, industry-leading Business Intelligence tools (BI tools), Looker and Tableau, were acquired by Google and Salesforce for over $18 billion combined. These massive deals show that BI tools and data warehouses are a powerful combo that companies across the globe are incorporating into their tech stacks.
So, we rely on software, spreadsheets, and statistical packages to make our best judgment calls. In this article, you’ll learn about a new genre of customer analytics capabilities that speak the language of people, rather than systems. If you use Looker, for instance, you probably rely on this platform’s data capabilities.
Reveal Embedded Analytics. Choosing the right embedded analyticsplatform for your business needs is paramount. Table of contents: What are embedded analyticsplatforms? Embedded analytics benefits Top 7 embedded analyticsplatforms Reveal Looker Toucan Sisense Logi analytics Tableau Power BI.
Reveal Embedded Analytics. This is where tools such as Reveal and Looker come in handy – they convert raw data into easy-to-understand and easy-to-use insights that enable organizations to reshape and modernize the way they do business. What is Looker? What Is Looker? Table of contents: What is Reveal?
From early computer systems (basically operating on arithmetic) to the priests of Oracle and IBM. From siloed systems to open source technology that bridges the gap between data engineering and data analysis. That birthed a whole new suite of job titles and tools. From punch cards and filing drawers to early computers.
The article explores the best Zendesk integrations for: Customer support Customer feedback Productivity Email and social media communication Analytics and reporting Let's get right to it! Zendesk communicates with external apps via API, so creating integrations is easy. How many apps does Zendesk have?
G2 has named Indicative as a Leader in Customer Journey Analytics in G2’s 2020 Summer Report. . Indicative is the only Customer Analyticsplatform designed specifically for non-technical business users that connects directly to your data warehouse. High Performer in Digital Analytics. “Amazing end-to-end solution.”
Gone are the days of selling “software in a box.” Compared to one-time-purchase software, SaaS products offer a few key benefits. Product analytics help you uncover important insights to answer questions including what is your product’s key activation event that results in longer user retention? opportunities).
In 2019, industry-leading Business Intelligence (BI) tools, Looker and Tableau, were acquired by Google and Salesforce for over $18 billion combined. More recently in 2020, cloud-based data warehouse Snowflake went public at an eye-popping market capitalization of $70 billion. Analysis depth vs. breadth.
In another blog , we provided a look at how we implemented a product-led growth (PLG) strategy at Mixpanel from a data and analytics perspective. To make that happen, we wanted all of our activity data related to marketing, sales, product usage, and paid conversion in a single Mixpanel project. Here’s how we did it. It’s working!
In the age of data and analytics, we’ve come to believe that, with enough data, we can make smart decisions and become truly data-driven. Adding to the complexity is the need to find the right tools to manage the different types of data — you can pound in a nail with a wrench, but that’s not what it’s built for. Processing.
While a bachelor’s degree in a relevant field like computer science, information systems, or statistics is often preferred, it’s not always a strict requirement. Userpilot is an all-in-one product platform with engagement features and powerful analytics capabilities. Book a demo to see it in action!
Master Google Analytics 4 for user behavior analysis, UX design optimization, and enhanced website performance to improve sales. Hi there, I was looking into Google Analytics 4 and found an article by Alice Emma Walker. If you know about Universal Analytics , it’s going away on July 1, 2024. It’s six years old.
Reveal Embedded Analytics. Among all embedded analytics products on the market, Tableau is certainly one of the most popular BI tools for analyzing, visualizing, and working with data. But like any other softwaresolution on the market, Tableau is also not perfect and surely not the best fit for every business use case.
From understanding the analytics landscape to mapping capabilities with KPIs and integrating new tools with your current stack, we know that choosing a product analyticssolution can be overwhelming—not to mention, time-consuming. How is Mixpanel different from marketinganalyticstools like Google Analytics?
While a bachelor’s degree in a relevant field like computer science, information systems, or statistics is often preferred, it’s not always a strict requirement. Looking into tools for business intelligence analysts? Userpilot is an all-in-one product platform with engagement features and powerful analytics capabilities.
For marketing teams focused on getting more user traffic and signups, Google Analytics has been the tool of choice. But with customers spending more time researching and buying online, websites and product experiences are converging to accommodate customer needs, and the scope of analysis for most marketers is increasing.
Here are some essential tools: Best tool for feedback collection and product analytics – Userpilot : A no-code tool, Userpilot lets customer insight managers trigger in-app surveys, conduct funnel and path reports, and visualize data on custom dashboards that are easily sharable with stakeholders.
Whether you’re looking to deepen your expertise, stay updated with industry trends, or find practical tools to enhance your workflow, the right resources are essential for continuous growth and success. Consider Userpilot for its engagement features and analytics capabilities. Book a demo today!
Best tools for product analysts Best tool for Product Analysis ( Userpilot ) : Userpilot gives you insight into your product performance and helps you understand user behavior. Best tool for Product Insights (Mixpanel) : Mixpanel helps you understand your customer experience and find out what works and what does not.
By empowering customers to make the most of its platform, Popmenu demonstrates value well beyond being a service provider to its customers. Carie Buchanan, CXO, and Savannah Greene, Director of SolutionsMarketing at Popmenu , shared their approach during our Essentials Business Review webinar.
When it comes to the four pillars of product analytics maturity , collaboration is the part we on Mixpanel’s Customer Success team are asked about the most: “How can we improve our collaboration?” To centralize data, you can use formal tools such as Confluence or Notion, or you can utilize Lexicon in Mixpanel.
Analytics tracking plans are no different – tracking plans (and the instrumentation of them) are collaborative by nature. An analyst or analytics engineer is responsible for modeling the data and will care about its structure, and you might have several teams responsible for building reports and analysing the data in several tools (e.g.
✅ Verified : Celine Liu , Uber's former Global Analytics Lead, wrote this guide. Celine has conducted 100+ interviews across analytics, operations, and strategic roles. This means showing that you can move fast with scrappy tools, reason about the business, and explain what the numbers mean , not just what they are.
I found myself writing stories, pulling together some analytics, doing ‘normal’ Product Manager things. In this discussion, he shares how he is blurring the lines between product development, product management, design, analytics, strategy, and operations at Drift to create the role they now know as Product Operations.
Time and again, folks have used product analyticstools to better understand their customers. Businesses use analytics to determine product health, improve the customer experience, test product-market fit, and ensure that they are making the right investments with limited time and resources.
Where does product analytics fit in the realm of analyticstools on the market? What makes product analytics different from marketinganalytics? How are product teams using analytics in their day-to-day work? You can find a full transcript below. I need to be on the web. What am I going to do?”
Where does product analytics fit in the realm of analyticstools on the market? What makes product analytics different from marketinganalytics? How are product teams using analytics in their day-to-day work? You can find a full transcript below. I need to be on the web. What am I going to do?”
Sign up for internal training that covers company-wide policies and systems. What are some tricky points to keep in mind when exploring point solutions? Or, does your company use identity and access management software, such as Okta. Suggested approach for meet & greets: Take good notes! What is working well?
We organize all of the trending information in your field so you don't have to. Join 96,000+ users and stay up to date on the latest articles your peers are reading.
You know about us, now we want to get to know you!
Let's personalize your content
Let's get even more personalized
We recognize your account from another site in our network, please click 'Send Email' below to continue with verifying your account and setting a password.


Let's personalize your content