Remove types-of-charts
article thumbnail

Reveal 1.6.0 Features Are Here!!

Reveal

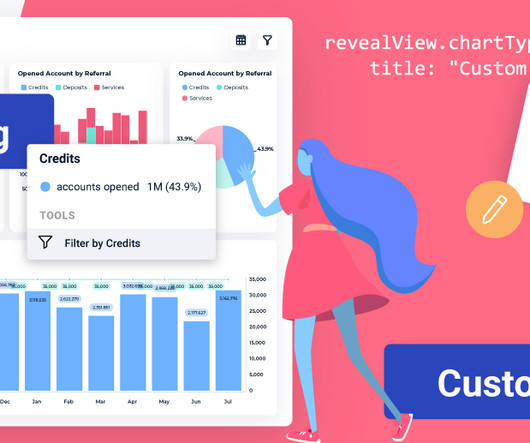
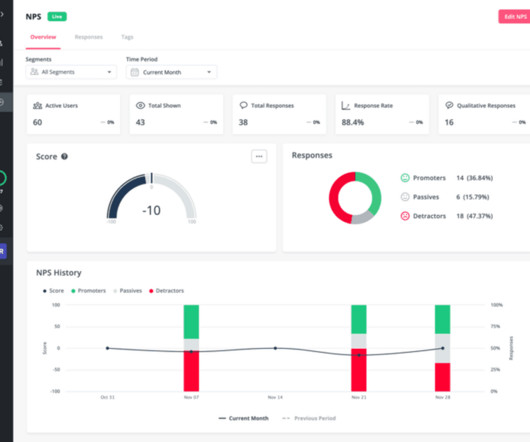
In this blog post, we’ll dive into the key highlights, with a particular focus on two standout features: custom visualizations and interactive chart filtering. DIY Custom Visualizations with Reveal With this innovative addition to our platform, you can now control the chart types available within your dashboards.
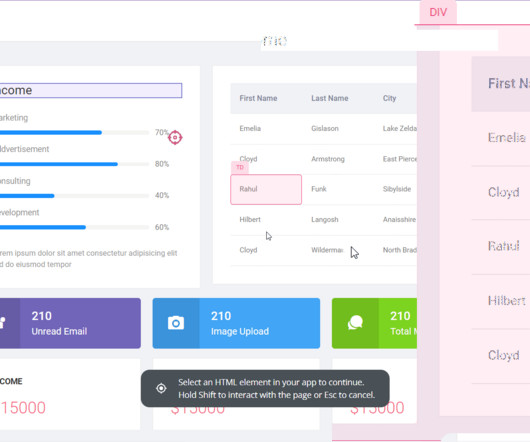
article thumbnail

Funnel Charts for SaaS: The Complete Guide

Userpilot

What are funnel charts and how to use them to gain insights into user progress along their journeys? We also look at situations when funnel charts are most suitable, their limitations, and alternative ways of visualizing data. A funnel chart helps you to track how many users have reached the activation stage.

Insiders

Sign Up for our Newsletter

This site is protected by reCAPTCHA and the Google Privacy Policy and Terms of Service apply.

article thumbnail

10 Analytics Dashboard Examples to Gain Data Insights for SaaS [+Best Tools]

Userpilot

It will give you a better understanding of the type of metrics to monitor in your dashboard and help you draw product growth insights from them. Therefore, you need to keep different dashboards for different types of analytics. Analytics dashboards are visualization tools that give you an overview of key metrics.

article thumbnail

Create Effective Dashboard Templates with Ease

Reveal

In this blog, we will explore the concept of dashboard templates and provide a step-by-step guide on creating custom dashboard templates with the Reveal embedded analytics solution. They typically include various data visualizations , such as charts, graphs, tables, and interactive elements like filters and dropdown menus.

article thumbnail

5 Funnel Analysis Examples For SaaS Companies (+ Process & Tools)

Userpilot

Visualize the journey with a funnel analysis chart. Visualize the journey with a funnel analysis chart Using a product analytics tool such as Userpilot , define the customer journey by adding events in the order that users should complete them. Map out each stage in the customer journey. Identify drop-off points from the report.

article thumbnail

Survey Data Analysis for SaaS: Understanding User Feedback At Scale

Userpilot

Types of survey data There are 2 main types of survey data you should collect. Quantitative data This type of data refers to numerical data or information you can measure, count, or express using numbers. Wondering how to unlock the full potential of your survey data and if survey data analysis will be of any help?

article thumbnail

Pendo vs Amplitude: Which is the Better Product Analytics Tool?

Userpilot

Pendo vs Amplitude? Which of them should you choose to generate growth insights for your product? This is a serious dilemma. In our article, we aim to help you make the decision. We also have a quick look at Userpilot as an alternative for each of the tools. How does this sound? Ready to dive in? Amplitude doesn’t support this functionality at all.