This site uses cookies to improve your experience. To help us insure we adhere to various privacy regulations, please select your country/region of residence. If you do not select a country, we will assume you are from the United States. Select your Cookie Settings or view our Privacy Policy and Terms of Use.
Cookie Settings
Cookies and similar technologies are used on this website for proper function of the website, for tracking performance analytics and for marketing purposes. We and some of our third-party providers may use cookie data for various purposes. Please review the cookie settings below and choose your preference.
Used for the proper function of the website
Used for monitoring website traffic and interactions
Cookie Settings
Cookies and similar technologies are used on this website for proper function of the website, for tracking performance analytics and for marketing purposes. We and some of our third-party providers may use cookie data for various purposes. Please review the cookie settings below and choose your preference.
Strictly Necessary: Used for the proper function of the website
Performance/Analytics: Used for monitoring website traffic and interactions
The Value of Using a Jobs Dashboard to Drive Your Demo Most software sales demos follow the same formula a handful of slides telling buyers about your company followed by an overview of the product, and then you dive into the demo. The jobs dashboard is your way of serving the meal in easily digestible portions.
Reveal Embedded Analytics We know how difficult it is to create dashboards, especially for web applications. Thats what dashboards are for. In fact, Angular dashboards can provide key insights that will eventually allow data-driven decision-making at your company. It offers several options when it comes to dashboard libraries.
A dashboard showing metrics like feature adoption or user engagement amplifies your credibility. How to Get Started: Create Dashboards: Track key metrics like churn, engagement, or feature adoption that align with business goals. Analyze Trends: Use historical data to inform recommendations and showcase strategic thinking.
For product designers, it highlights usability issues , thereby informing design iterations and ensuring more customer-centered solutions. Here are some reasons why: Human expertise & interpretation : Information is not in the data. For example, welcome surveys for gathering information on user JTBD.
Speaker: Daniel O'Sullivan, Product Designer, nCino and Jeff Hudock, Senior Product Manager, nCino
In a world of information overload, it's more important than ever to have a dashboard that provides data that's not only interesting but actually relevant and timely. Dashboards assist decision makers facilitate new ideas and business opportunities, increase customer approval rates, and analyze current business process.
A product analytics strategy is essential for any business looking to make informed decisions about product development and user experience. Creating an expansion revenue dashboard with Userpilot without coding. It tracks key metrics such as feature usage , user flows, and behavior patterns to explore user preferences and pain points.
This would then allow other groups at eBay to start using this information to create new buyer and seller experiences. Even if you are used to dashboards, not every outcome is measurable, and you must not confuse the outcome with your progress monitoring. With that focus in mind, we started rolling. We were super strict on delivery.
Why product analytics fails The ongoing process of tracking analytics is riddled with errors and roadblocks that prevent teams from making informed decisions. Often due to analysis paralysis , overwhelming amounts of information, or a lack of clear insights that drive product decisions. This causes siloed data and integration issues.
The best retail companies use feedback to inform product decisions, align teams around the Voice of the Customer, and fix whats not quite working. Turn survey responses, review data, and post-purchase feedback into clear dashboards your teams can actually use. But this system only works if you take action on the feedback collected.
Speaker: Miles Robinson, Agile and Management Consultant, Motivational Speaker
Dashboards and analytics can really set your application apart, but that doesn't mean you can implement them and forget about them. Join Miles Robinson, former UX and Design Manager, as he explains the different ways to refresh your dashboards - and how to determine what's the best path to product dashboard success.
Your customer information lives in Salesforce, while your support tickets are in Zendesk, your product usage data in Mixpanel, and your marketing campaigns in HubSpot. Based on your current dashboard, it looks like most users churn before completing onboarding. Sound familiar? Which features need attention?
If you know when users typically engage, use that information to create push notification campaigns that re-engage users while respecting their schedules. They include the customers name and regularly inform them when their favourite product is back in stock. Remind them where they left off. Its all about maintaining relevance.
Why embedded analytics adds value to your data strategy The difference between product analytics and embedded analytics Without data-driven insights, your product risks falling behind competitors who make better-informed decisions. Product analytics gives you the information needed to make smarter, faster decisions.
They communicate changes, fixes, additional features, and upgrades associated with the new release and provide key information (if required) to help users navigate the latest updates. Sunsetted features : Focused on features or services being retired, these notes inform users about timelines and provide alternatives.
But today, dashboards and visualizations have become table stakes. Think your customers will pay more for data visualizations in your application? Five years ago they may have. Discover which features will differentiate your application and maximize the ROI of your embedded analytics. Brought to you by Logi Analytics.
Empower with Data and Tools Equip your teams with the resources they need to make informed decisions. Whether its customer feedback, analytics dashboards, or training in decision frameworks, make sure they have what they need to succeed. Where did delays occur? Use this insight to refine your approach.
Here’s what information it includes: Demographics: I only capture the persona’s professional occupation relevant to our product’s B2B profile. Ensure there’s no unnecessary information that would distract from the most important insights. However, you should always collect real user data instead of relying on gut feelings.
Instead of turning insights into engagement and revenue, slow dashboards frustrate users and stall adoption. Slow dashboards or unresponsive queries quickly erode user trust. Designed for centralized dashboards and batch reports, they struggle to support the demands of modern applications. This isn’t a minor inconvenience.
Leveraging product analytics isnt just about making pretty dashboards; its about viewing your existing data as a learning opportunity to make informed decisions with your onboarding strategy. At Userpilot, we create quarterly dashboards organized by release. These dashboards dont just collect numbers; they tell a story.
Tools like Usersnap streamline the Product Discovery Lifecycle (PDLC) by providing actionable feedback and insights that guide informed decision-making across discovery, design, and development. 5 Vendor-Specific and Competitor Questions Understanding the competitive landscape and vendor preferences informs product positioning.
It is also counterintuitive to think that less information might actually benefit users. By using minimalistic dashboards or progress trackers, such as Youre 70% toward your debt-free goal, we help reduce anxiety and keep users engaged. Data Privacy and Security: Protect sensitive financial information with robust safeguards.
It helps you: Understand satisfaction levels Identify pain points and product gaps Make informed business decisions Improve loyalty and retention Develop more relevant marketing and messaging Simply put, feedback takes the guesswork out of CX, product, or marketing decisions. They don’t wait for feedback to pile up in dashboards.
This information empowers teams across your company to make informed decisions based on customer experiences and perceptions. Real-time analysis helps respond to trends as they arise, with dashboards visualizing results for quick, data-driven decisions. Customer satisfaction surveys are more powerful than you might think.
Teams organize features into an information architecture, then bundle them into menus, apply usability fixes, and run some user testing to improve comprehension. They assume the solution is always an app, a dashboard, or a full-screen interface. And only then somewhere towards the very end — you call in design for making it “creative”.
Use dashboards to track actuals against forecasts in real time, highlighting variances early. Publish roadmap updates, positioning guides and key selling points in a central hub so sales is always working with current information. Set up regular reports or dashboards that tie support volumes to product areas or features.
Reports & analytics : Provide tailored analytics, dashboards, and reporting capabilities to track customer engagement, identify trends , and enable data-driven decision-making for improved customer success. Reporting and dashboards for outcome tracking. Reporting and dashboards for keeping a real-time pulse on customer sentiment.
Factors I consider when evaluating customer analytics tools Important core features Analytics dashboards : Provide real-time visualizations of key performance indicators (like active users and page views) at a glance, so you can easily track changes. Example of a Userpilot dashboard showing free trial to paid user conversion rate.
With its powerful analytics, you can organize and analyze survey responses efficiently to make informed decisions. You can use this feedback to make informed decisions about product updates, customer support, or marketing strategies. Product feedback software: SurveyMonkey. Qualtrics Type : Voice of customer tool.
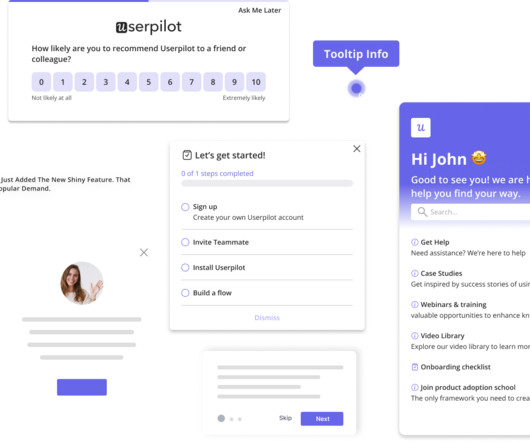
They’re ideal for sharing and collecting the necessary initial information. Tooltip added to a Userpilot ’s analytics dashboard. Hotspot added to a Userpilot ’s analytics dashboard. Following that, you’re prompted to set up 2FA security and review the provided information before completing the setup.
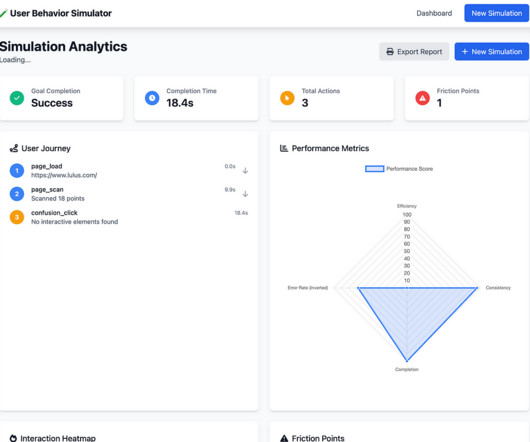
Home Dashboard (left) and Post Simulation Analytics (right) Taking a closer look at the end result, here’s what stood out to me about the process. To begin, it generated a wizard like step by step UI and entirely looked over a project management dashboard type entry point, even after prompting. It made friction points visible.
Or, you can discover that simplifying your project dashboard (based on low engagement metrics) retains more customers. Visualize the collected data through dashboards and reports Effective dashboards combine session recordings with various report types to reveal actionable trends.
Communicate findings effectively A well-structured custom dashboard makes it easier for you to share insights across teams. When we launch a new feature, we create a funnel dashboard to measure how many users discover, activate, and keep using it. Looker Studio: Best for creating free, customizable dashboards with Google integrations.
It helps you monitor brand awareness, customer loyalty, competitive positioning, and overall brand equity—so you can make informed decisions when it matters most. Real-time insights: Get full access to a powerful dashboard that gives you an always-on view of your brand performance—no waiting on reports.
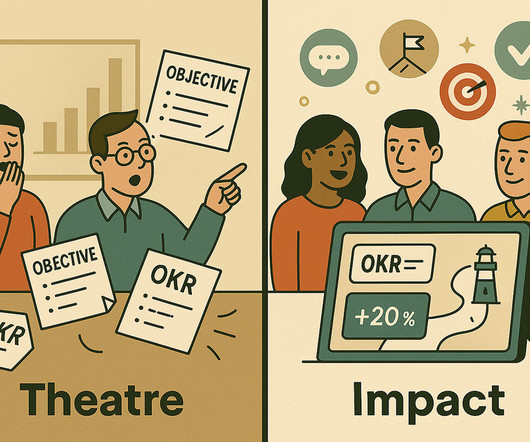
Whether it’s a dashboard, shared workspace, or check-in ritual, create ways for teams to see how they’re tracking against objectives — not just at the end of the quarter, but in the day-to-day. When teams can see progress — or blockers — they’re better equipped to make informed decisions and support one another.
Track these user engagement metrics to get that data so you can measure success, identify friction points, and make informed decisions. Next, create an analytics dashboard to display these metrics and share it across teams to make sure that everyone is on the same page and can focus on what matters most. Example tracking plan.
Instead of jumping to add more meetings, asking, What information is getting lost? This insight could lead to implementing shared dashboards or concise weekly recaps, fostering clearer communication and smoother collaboration. Imagine a hybrid team struggling with communication. or How can we make updates easier to access?
Digital artifacts, such as explainer videos, interactive calculators and gamified content provide an additional layer of engagement that informs as well as entertains. The user journey-from the first login screen to the advanced investment dashboard-must reflect the institutions identity.
Spatial Information Architecture Reimagine navigation, menus, and content layout in 3D space. With a Digital Twin: Real-time sensor anomalies are visualized via a digital dashboard. Example: Holding your palm open resets the interface to default. Motion Sickness Prevention Prefer teleportation or fade-in effects over smooth locomotion.
For example, let’s say a $100k ARR company (enterprise subscriber) reports their custom SSO integration is failing, a $10k ARR company reports dashboard loading slowly, and a $1k ARR company reports an issue with a new feature. Effort required to resolve the issue. A/B test results.
Having siloed data and making wrong decisions because of this: Fragmented tools store information separately, making it nearly impossible to form a clear picture of customer behavior across channels. Display the right information at the right time, ensuring users can self-serve and get the help they need without leaving the app.
Paths and funnels provide granular information to track users interactions with your app. Userpilot analytics dashboards can help you add relevant metrics and keep an eye on any changes that may occur. Userpilots Analytics dashboards. User persona example. So, you can see interactions with your mobile app in real-time.
Consistently update it to ensure users stay informed about newly released features or workflows. Instead of juggling countless email threads or Slack messages, you manage everything from a central dashboard. Users know exactly where to submit questions; automated notifications keep them informed of updates.
I thought I was saving my team time by filtering information. They were responsible for sharing information back to their group and bringing forward corresponding insight. This approach prevents information gaps and promotes a more responsive dynamic. Instead, I was creating anxiety. Be your authentic self.
For example, say a user opens your app, skips the onboarding tutorial , and heads straight to the dashboard. Gathering all this information directly leads to better product decisions. For example: Suppose users are dropping off before finishing their dashboard setup. Analytics dashboard via Google Analytics.
We organize all of the trending information in your field so you don't have to. Join 96,000+ users and stay up to date on the latest articles your peers are reading.
You know about us, now we want to get to know you!
Let's personalize your content
Let's get even more personalized
We recognize your account from another site in our network, please click 'Send Email' below to continue with verifying your account and setting a password.


Let's personalize your content