This site uses cookies to improve your experience. To help us insure we adhere to various privacy regulations, please select your country/region of residence. If you do not select a country, we will assume you are from the United States. Select your Cookie Settings or view our Privacy Policy and Terms of Use.
Cookie Settings
Cookies and similar technologies are used on this website for proper function of the website, for tracking performance analytics and for marketing purposes. We and some of our third-party providers may use cookie data for various purposes. Please review the cookie settings below and choose your preference.
Used for the proper function of the website
Used for monitoring website traffic and interactions
Cookie Settings
Cookies and similar technologies are used on this website for proper function of the website, for tracking performance analytics and for marketing purposes. We and some of our third-party providers may use cookie data for various purposes. Please review the cookie settings below and choose your preference.
Strictly Necessary: Used for the proper function of the website
Performance/Analytics: Used for monitoring website traffic and interactions
How Rumi Cosmetiques Boosted UserExperience and Conversion Rates in eCommerce: A Case Study for Marketers andManagers Discover how Rumi Cosmetiques achieved a 75% increase in cart adds and doubled conversion rates by enhancing userexperience and conversion rate in eCommerce.
Case Study: Improving Data-Driven Decision Making for CSR Leadership Civian is a data-driven platform designed to help businesses measure, optimize, and showcase the social and economic impact of their investments in communities. Our Process To make our interviews more fruitful, we established specific research objectives.
Unfortunately, the research backs this up, with a staggering 90% of users reporting that they stopped using an app due to poor performance. Basically, anything that ruins the userexperience. UX analytics involves gathering, analyzing, and interpreting data about how users interact with your product or service.
A customer sentiment dashboard is a great way to visualize customer feedback and see what users love (or hate) about your product. TL;DR A sentiment analysis dashboard typically integrates information from multiple data sources, such as social media posts, customer reviews, survey responses , and customer service chats.
Through case studies, statistical evidence, and methodological frameworks, I aimed to establish how systematic user research can positively impact key business metrics, from acquisition to referral. d) Exploratory Persona Research: Detailed studies to develop personas based on actual research, not assumptions.
Awareness: When users know about your product, and you have their attention. Interest: When users start interacting with your product in a meaningful way. Desire: When usersexperience the value of your product and are motivated to convert. Action: When users convert. Case Study: 8x8’s Jitsi.org.
Choose UX research tools with essential features , collaboration, reliable support , user-friendliness, scalability , integrations , and strong security. Userpilot enhances userexperience through in-depth UX research, offering features to gather, analyze, and act on customer feedback.
Disclaimer This case study is a conceptual project and is not affiliated with or endorsed by Google. However, for this case study, Instead of developing new applications, integrating financial management features into Google Pay can leverage its large user base for seamless userexperiences.
. – Isa Olsson, UX Researcher and Designer at Zoezi Finally, Zoezi users had no easy way to report issues from within the product. They had to leave the app and use email, which was inconvenient and led to poor userexperience. Zoezi uses Userpilot mainly to: Monitor product usage from the analytics dashboards.
For example, let’s say a $100k ARR company (enterprise subscriber) reports their custom SSO integration is failing, a $10k ARR company reports dashboard loading slowly, and a $1k ARR company reports an issue with a new feature. Click here to read the full case study about The Room. Effort required to resolve the issue.
Much of the literature that defines the role as the intersection of business, technology, and userexperience isn't particularly helpful for practitioners who are left wondering what skills they need to learn versus the fine people they work closely with in actual business, technology, and userexperience roles.
The study by the Design Management Institute analyzed the performance of design-led organizations that place influential design decisions at the top as compared to the Standard & Poor’s index over 10 years. To increase working efficiency, users can tweak dashboards and choose the most topical tabs. UX does matter.
Introducing core features, driving user activation, and maximizing retention rates after the user onboarding experience will all impact the user journey moving forward. In this guide, we’ll look at eight user onboarding case studies that can provide inspiration for your own onboarding flows!
Tali was so excited to share her experience with opportunity solution trees, she led a workshop at UXDX in Dublin. To prepare for the workshop, Tali created a fictional case study, and with the help of ChatGPT, she generated six interview snapshots and some analytics dashboards.
1 Engagement DAU/MAU Understand daily and monthly active user engagement and overall app popularity. 2 Engagement Feature adoption Gauge user interest in new features and optimize feature development. 3 Engagement Average user session length Measure user interactions and identify areas for improved content or flow.
One look at your mobile app analytics dashboard, and you just want to shut your eyes and scream in frustration. You aim to extract meaningful insights to improve app performance and user engagement. Validating one with the other gives you the whole picture and confidence to make decisions that improve usersexperience.
When you see users creating workarounds, repeatedly checking settings, or abandoning flows at specific points, you uncover the reasoning behind the metrics. Take a look at real userexperiences to understand your users better Conventional tools show you what’s happening, but understanding why requires deeper analysis.
They even let the user know how much time they have left on the paid trial. Also, check out this slideout that comes up when you start exploring the dashboard: Source: Ahrefs.com. The point is, the user knows exactly what they need to do to start solving their problem. This creates trust and a more personalized userexperience.
New Dashboards for AWS Services This is just a quick blog to draw attention to some new and enhanced monitoring dashboards we have added to eG Enterprise in the upcoming release (v 7.2) As with all our dashboards, color-coded overlays provide guided drilldown for help desk operators and administrators.
Customer analytics is the cornerstone for making informed decisions, enhancing the userexperience, and, ultimately, fostering growth. To collect both quantitative and qualitative data, you should use user surveys, event analytics , and dashboards to track core metrics. This allows you to create positive userexperiences.
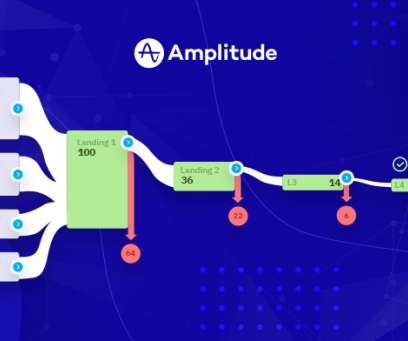
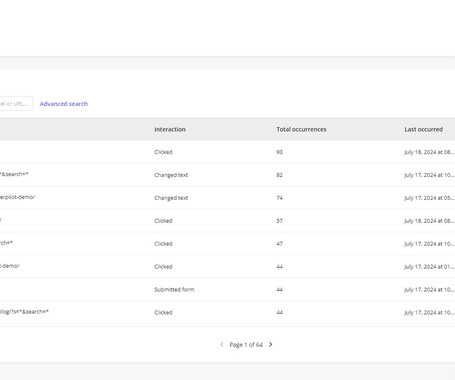
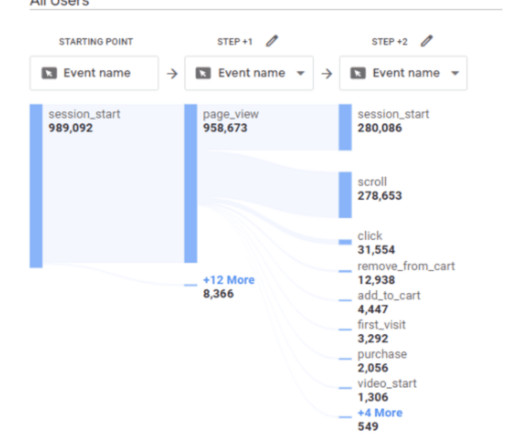
Event analytics is a great way for SaaS companies to studyuser interactions to gain actionable insights into the customer journey. Knowing what steps users take to perform an event can help uncover friction points that are ruining the customer experience. Filter event occurrence by user type in Userpilot.
TL;DR Choose a product management platform with advanced features, a user-friendly interface, customization, third-party integrations, scalable pricing, robust security , and collaboration features. Userpilot is a top product management software that enhances userexperiences by effectively monitoring user behavior.
Add different types of modules and educational resources Userpilot supports a variety of content formats, including articles, case studies, videos, webinars, and more. That, in turn, lets you cater to your user bases diverse learning needs. Its particularly helpful when you cater to a global user base.
Qualitative data is non-numeric information that accounts for user sentiments and can provide insights into real-world issues. Here are five steps that can help you analyze survey data: Visualize quantitative data to study answer distribution. Pair survey data with user behavior analytics. Book a demo today!
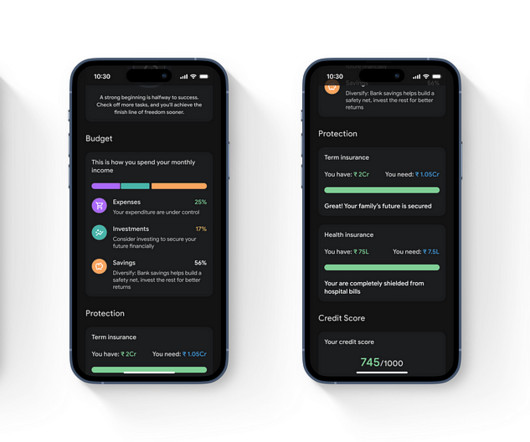
Photo by NordWood Themes on Unsplash Measuring userexperience (UX) has always been a complex challenge, requiring a blend of creativity and data-driven precision. Lets look at FinTrack, a hypothetical financial management tool that helps users with budgeting, expense tracking, and financial goal setting. The result?
Awareness: When users know about your product, and you have their attention. Interest: When users start interacting with your product in a meaningful way. Desire: When usersexperience the value of your product and are motivated to convert. Action: When users convert. Case Study: 8×8’s Jitsi.org.
Free to paid conversion rate This user metric measures the percentage of users who upgrade from a free trial to a paid plan. The free to paid conversion rate is a metric for assessing your onboarding and initial userexperience. User retention rate formula.
In short, user path and product analysis are a necessity for all product managers trying to design a smooth userexperience. So let’s look at how you can use user path analysis to your advantage. Studyuser paths to design an optimal onboarding flow. Usage patterns across multiple user paths.
TL;DR Customer behavior analysis involves studying how users interact with a product to understand their needs, motivations, and pain points. Analyzing customer behavior helps make data-driven decisions, identify friction points in the user journey, and increase customer satisfaction and retention. Userpilot dashboard builder.
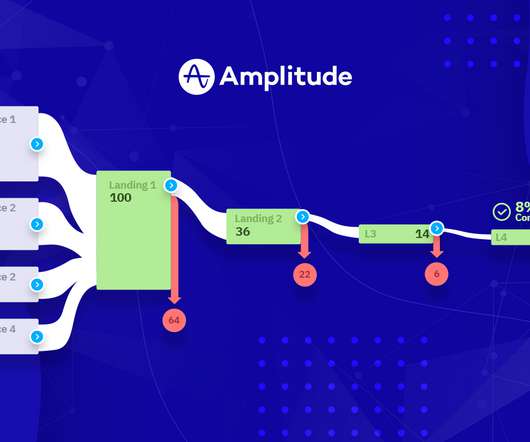
How can you identify drop-offs with product analytics and user surveys? What strategies can you use to reduce drop-offs and improve the userexperience? It signals decreased engagement and indicates friction in the userexperience. Prioritize feature development as per user needs. Increase feature adoption.
Userpilot offers a more intuitive userexperience and greater value for money than Pendo. Try Userpilot and Take Your Product Experience to the Next Level Get a Demo 14 Day Trial No Credit Card Required Challenge: Extracting value from Pendo Cuvama faced a few challenges when using Pendo for its onboarding and analytics needs.
This guide covers everything you need to know about outsourced software product development services , from core definitions and benefits to a stepbystep process, pros and cons, realworld case studies, and future trends. Prototyping and design: Wireframes, mockups, userexperience flows.
No-code and low-code data collection : Allows non-technical users to gather and manipulate data easily, democratizing data access and improving productivity. Reports and dashboards : Presents data in a digestible format, providing real-time insights and key performance indicators to help teams monitor progress and make informed decisions.
Qualitative data: Understanding the “Why” behind the numbers Unlike quantitative data, which measures trends through hard numbers, qualitative studies provide a deeper context by analyzing non-numerical data like user feedback and surveys. It answers questions like: What do users think about a new feature?
They began with China , which has one of the worlds biggest populations of language learners, with high demand for affordable, self-paced study. Today, the apps user interface is localized in 28 languages and reaches over 103 million monthly active users. Pro tip: Localize your store listing and your first-time userexperience.
Regularly collect and act on customer feedback to improve the userexperience. Create a customer retention analytics dashboard to measure success across key metrics. Personalized onboarding experiences focus on specific user needs and introduce only features and information relevant to their use cases. The result?
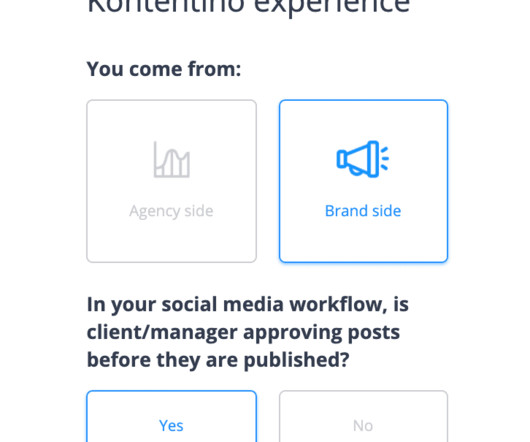
Discovery phase The aim of the discovery phase is to give you a general understanding of user needs and the context in which you’re building the product. Userexperience surveys User surveys are one of the most popular research methods. There are a few good reasons for that. How do you do it efficiently?
Build high-touch and subtle userexperiences to unleash customer success. So, what are the subtle userexperiences? Subtle userexperiences are those that don’t force the user to take them. Growbots Case Study. How does Growbots onboard users? But, what does that mean in practice?
They don’t just crunch numbers; they translate their findings into clear and compelling stories through reports, dashboards, and presentations. BI Analyst (3-5 Years) : You’ll take on more responsibility for independent data analysis, report creation, and dashboard development.
Hopstack’s differentiator is its exceptional userexperience. The platform allows users to customize their dashboard UI by adding/removing elements, depending on the project they’re working on. Users have complete control over their interface, which makes ClickUp the preferred tool of many.
User behavior analytics helps you understand how users engage with your SaaS. By digging into the user flow data, you can spot friction points and identify improvements to enhance the userexperience. In this article, we answer the question: how does user behavior analytics work?
Userpilot is a product growth platform with a robust user sentiment layer. It enables you to collect user insights with in-app surveys and analyze them with an intuitive dashboard. Try Userpilot and Take Your UserExperience to the Next Level Get a Demo 14 Day Trial No Credit Card Required What is customer feedback?
A product adoption software or digital adoption platform is a type of software that enhances the userexperience and aids user adoption through helpful flows, in-app guidance, tooltips, etc. It guides users through a product’s features and functionalities to drive engagement and boost long-term adoption.
TL;DR User behavior patterns refer to the common behaviors people demonstrate while using an app. Behavioral analysis aims to identify these trends to improve the userexperience. Monitoring patterns in user behavior offers several benefits, including improved product adoption and reduced churn.
We organize all of the trending information in your field so you don't have to. Join 96,000+ users and stay up to date on the latest articles your peers are reading.
You know about us, now we want to get to know you!
Let's personalize your content
Let's get even more personalized
We recognize your account from another site in our network, please click 'Send Email' below to continue with verifying your account and setting a password.


Let's personalize your content