This site uses cookies to improve your experience. To help us insure we adhere to various privacy regulations, please select your country/region of residence. If you do not select a country, we will assume you are from the United States. Select your Cookie Settings or view our Privacy Policy and Terms of Use.
Cookie Settings
Cookies and similar technologies are used on this website for proper function of the website, for tracking performance analytics and for marketing purposes. We and some of our third-party providers may use cookie data for various purposes. Please review the cookie settings below and choose your preference.
Used for the proper function of the website
Used for monitoring website traffic and interactions
Cookie Settings
Cookies and similar technologies are used on this website for proper function of the website, for tracking performance analytics and for marketing purposes. We and some of our third-party providers may use cookie data for various purposes. Please review the cookie settings below and choose your preference.
Strictly Necessary: Used for the proper function of the website
Performance/Analytics: Used for monitoring website traffic and interactions
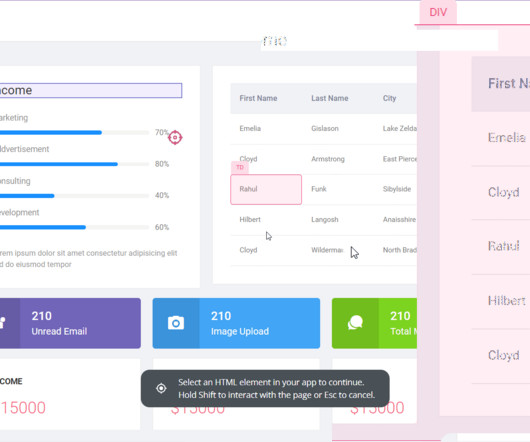
How to plan a dashboard people will use: 10 Key Steps Dashboarduser interface elements in light and dark modes Our team has built dashboards for a wide range of businesses, and we’ve picked up a few key insights along the way. A truly functional dashboard is always the result of collaboration.
You know your product collects tons of data. Datavisualizationtools help turn your messy spreadsheets into clear, interactive insights. The best ones dont even need SQL or data science skills. Because product analytics should be easy and accessible for everyone, not just data experts.
As you’re researchingdashboardreportingtools, you’ve probably noticed how hard it is to find reliable information on the available solutions. TL;DR Dashboards display critical business data in real-time, streamlining decision-making and focusing on key metrics. Let’s dive in!
Experts predict the CustomerAnalytics market will top $24 billion by 2025. That growth is driven by a common difficulty facing many of today’s businesses—mountains of data and no way for non-technical people to make sense of it. That’s where CustomerAnalytics comes in. Who are my best customers?
Speaker: Richard Cheng, Associate Product Manager, Mark43
Mark43 is on a mission to bring public safety data management into the 21st century. To fix traditionally paper-heavy and error-prone processes, they needed a secure and easy-to-use product experience that simplified and unified crime data collection and management. How efficient intelligence and analytics will benefit your users.
The “shiny penny” approach (focus all your attention on the hottest tools in the market) or “head in the sand” approach (fall victim to analysis paralysis and avoid choosing any tools) are no longer viable. But here’s the thing: a tool is not a strategy. The anatomy of a marketing tech stack [with recommended tools].
With companies relying entirely on data, it’s common sense to carry out SaaS reporting. The different reports can offer a variety of insights that help manage your product in the right direction. You just need to ensure you can get started correctly and the metrics you should report on to get the critical metrics.
If you are a SaaS company, the chances are you’ve come across the term “self-serve analytics” at some point online. Unlike traditional data analysis methods, self-serve analytics equips everyone in your organization to explore data and take the right actions in real time. Choosing a good business intelligence tool.
Their model involves solving one customer’s (very big and valuable) problem, then abstracting that solution into a product you can sell to everyone else. 95% of enterprise data problems involve access, cleaning and joining data, not analysis; companies that solve this integration challenge create tremendous value.
Every company, of every size — even organizations of just one person — are navigating a data avalanche problem. Every team — from product to marketing, and IT to engineering — is generating data. A strong analytics stack is foundational to being able to make sense of it all. Data Tracking and Collection. Event Data.
TL;DR A business intelligence (BI) analyst is a data specialist who helps businesses translate raw data into actionable insights. According to Glassdoor data, the estimated total pay for a Business Intelligence Analyst in the United States is $134,912 per year, with a base salary of $99,503 and additional pay of $35,409.
Master Google Analytics 4 for user behavior analysis, UX design optimization, and enhanced website performance to improve sales. Hi there, I was looking into Google Analytics 4 and found an article by Alice Emma Walker. If you know about Universal Analytics , it’s going away on July 1, 2024. It’s six years old.
Tracking cross-platform analytics is essential for product teams to see a complete view of customer behavior. TL;DR Cross-platform analytics is the activity of tracking and analyzing user behavior across multiple platforms or devices. When tracking user behavior on different platforms, it’s important to be consistent.
Data is the most valuable asset of our time. Part of the challenge is that the language of data isn’t always intuitive to our very human minds. In this article, you’ll learn about a new genre of customeranalytics capabilities that speak the language of people, rather than systems. The role of modern BI.
In 2019, industry-leading Business Intelligence (BI) tools, Looker and Tableau, were acquired by Google and Salesforce for over $18 billion combined. More recently in 2020, cloud-based data warehouse Snowflake went public at an eye-popping market capitalization of $70 billion. But there are two significant drawbacks to BI.
In the age of data and analytics, we’ve come to believe that, with enough data, we can make smart decisions and become truly data-driven. But as the global data volume has gone from big to enormous, many businesses today find themselves thinking: What do we do with it? The “ABCs” of data.
Product operations plays a key role here, conducting user issue analyses and building processes to prevent bad experiences. Key Tasks User issues reports. Identify, investigate, prioritize, and publish analyses on user issues to speed issue resolution. Bug Service Level Agreement (SLA). Product health tracking.
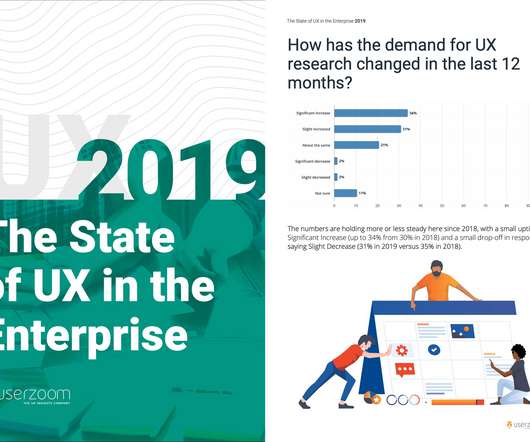
If you’re in the process of democratizing UX beyond the boundaries of your own UX team, and equipping other people in the organization with the skills to run their own research, s tandardization can increase efficiency and helps set expectations of what’s involved in a userresearch project. UX Researcher | GrubHub. “It
Below, we'll show you how to write the perfect data analyst resume. Highlight the most relevant projects that align with the goals of the data analyst role you're applying for. Highlight the most relevant projects that align with the goals of the data analyst role you're applying for.
These are some of the most common data analyst interview questions. ✅ Verified : Celine Liu , Uber's former Global Analytics Lead, wrote this guide. Celine has conducted 100+ interviews across analytics, operations, and strategic roles. Technical Round: Can include asynchronous SQL tests or live coding challenges.
Are you looking for Zendesk integrations to boost the efficiency of your self-servicecustomer support? The article explores the best Zendesk integrations for: Customer support Customerfeedback Productivity Email and social media communication Analytics and reporting Let's get right to it!
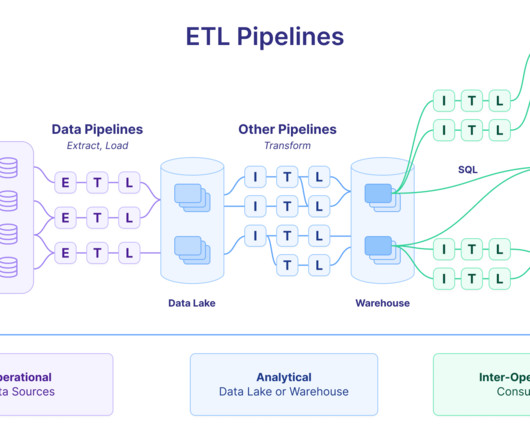
In another blog , we provided a look at how we implemented a product-led growth (PLG) strategy at Mixpanel from a data and analytics perspective. In this blog, I’ll pick up where we left off by walking through what we do with all of this joined data in BigQuery. Data structure for our Mixpanel project.
Reveal Embedded Analytics. Choosing the right embedded analytics platform for your business needs is paramount. Table of contents: What are embedded analytics platforms? Embedded analytics benefits Top 7 embedded analytics platforms Reveal Looker Toucan Sisense Logi analytics Tableau Power BI.
Reveal Embedded Analytics. Collecting data is easy, yet interpreting that same data is difficult. This is where tools such as Reveal and Looker come in handy – they convert raw data into easy-to-understand and easy-to-use insights that enable organizations to reshape and modernize the way they do business.
Embarking on a career as a customerinsights manager involves a combination of education, skills development, and practical experience. This guide will provide you with a comprehensive overview of the path to becoming a successful customerinsights manager. Let’s dive in!
From understanding the analytics landscape to mapping capabilities with KPIs and integrating new tools with your current stack, we know that choosing a product analytics solution can be overwhelming—not to mention, time-consuming. How is Mixpanel different from marketing analyticstools like Google Analytics?
Mixpanel is an analytics company, so I don’t have to tell you that we highly value using analytics to make better decisions and optimize the running of our business. Up until now, that was handled by Mixpanel and Looker, our BI (business intelligence) solution of choice. Why is this so important to share?
Reveal Embedded Analytics. Among all embedded analytics products on the market, Tableau is certainly one of the most popular BI tools for analyzing, visualizing, and working with data. Tableau has been helping businesses to transform raw data into valuable insights for more than 16 years.
TL;DR A business intelligence (BI) analyst is a data specialist who helps businesses translate raw data into actionable insights. Many successful BI analysts have transitioned from other fields by demonstrating their passion for data and acquiring the necessary skills through alternative routes. Let’s dive in!
We recently reached 1,800,000 current account customers – after launching in January 2018 – and are focusing on growing our user base and revenue. In the same time, we’ve grown overdraft usage from zero to over 100,000 people, and revenue from zero to break-even on a per customer basis. What would you be proud of?
Below, we discuss how to prepare for and ace data engineering interviews. 🧠 About this guide : Written by Thang Tran , a senior data engineer (ex-Amazon, Meta, and Apple) and Exponent interview coach. Reviewed by Deeptaanshu Kumar, a VP of data engineering (ex-Capital One, Freddie Mac). and schedule subsequent rounds.
Whether you’re looking to deepen your expertise, stay updated with industry trends, or find practical tools to enhance your workflow, the right resources are essential for continuous growth and success. Looking to leverage product data for insights? Consider Userpilot for its engagement features and analytics capabilities.
When it comes to the four pillars of product analytics maturity , collaboration is the part we on Mixpanel’s Customer Success team are asked about the most: “How can we improve our collaboration?” ” “How do we improve data sharing between teams?” ” “How do we create a data culture?”
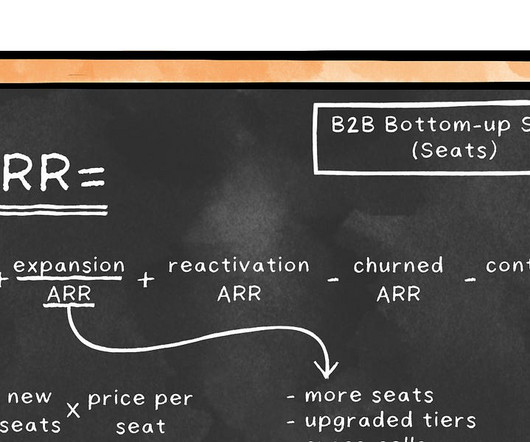
Please send us feedback (or leave a comment ) on anything you think we’re missing, or anything unique about your business that caused you to modify the equation you use. One key metric for every business is customer acquisition payback period. This won’t be perfect. We’d love to hear it.
Whether the pricing model is monthly, yearly, or otherwise, subscription-based pricing models keep revenue relatively predictable. As a result, you have endless opportunities to find new ways to continually engage—and retain—existing customers. Are users interacting with in-app features in the ways you want them to?
TL;DR A product analyst is a professional who conducts product research , analyzes, and interprets such data to make accurate decisions about the product. Product analysis involves two major things: the product and the data. Looking into tools for product analysts? Let’s dive in! Product Analyst. Product Analyst.
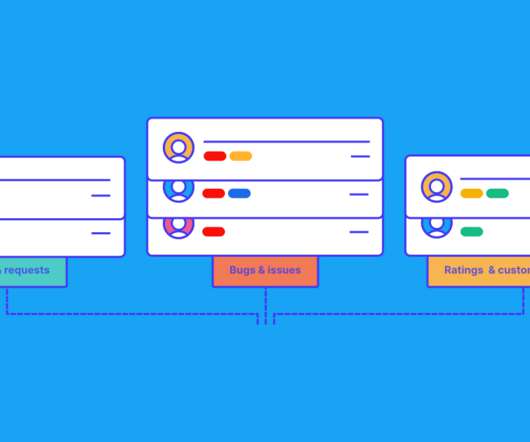
Ever found yourself getting loads of feedback, but didn’t have the customerfeedback system in place to do something with it all? Not only is it a mess for you, but it can also let your customers down when you don’t do something about their feedback. The customerfeedback system learning.
Have you ever made a costly mistake because your customerfeedback analysis wasn’t on point? Well, you thought you had actionable insights, but then the end result was a big floparoo? That gold mine list of feedback turned into a mine field? Feedback alone isn’t fully actionable and usable.
Testing in production is becoming more and more common across tech. The most significant benefit is knowing that your features work in production before your users have access. The following plan is both guidance and order of operations for what to implement if you want to start testing in production. The First 30 Days.
Below, we discuss how to prepare for and ace your data analyst interviews. ✅ Verified : Celine Liu , Uber's former Global Analytics Lead, wrote this guide. Celine has conducted 100+ interviews across analytics, operations, and strategic roles. She led the creation of our complete data analyst interview prep course.
Today, about one-third of Americans have used a dating app or site, and 12% have either been in a committed relationship or gotten married to someone they met through online dating, according to a recent Pew Researchreport. Driven by Data, Powered by the Heart . Data is core to the mission here at OkCupid.
For marketing teams focused on getting more user traffic and signups, Google Analytics has been the tool of choice. But with customers spending more time researching and buying online, websites and product experiences are converging to accommodate customer needs, and the scope of analysis for most marketers is increasing.
It is one thing to wax philosophically about “translating strategy”, “using data”, and “aligned autonomy”, and another thing to make it happen in the real world at a rapidly growing company. I found myself writing stories, pulling together some analytics, doing ‘normal’ Product Manager things.
“Data is a team sport” is something we believe strongly in and talk about often at Iteratively. Analytics tracking plans are no different – tracking plans (and the instrumentation of them) are collaborative by nature. Looker and Mixpanel). In short, in a data-led company analytics involves almost everyone.
We organize all of the trending information in your field so you don't have to. Join 96,000+ users and stay up to date on the latest articles your peers are reading.
You know about us, now we want to get to know you!
Let's personalize your content
Let's get even more personalized
We recognize your account from another site in our network, please click 'Send Email' below to continue with verifying your account and setting a password.


Let's personalize your content