This site uses cookies to improve your experience. To help us insure we adhere to various privacy regulations, please select your country/region of residence. If you do not select a country, we will assume you are from the United States. Select your Cookie Settings or view our Privacy Policy and Terms of Use.
Cookie Settings
Cookies and similar technologies are used on this website for proper function of the website, for tracking performance analytics and for marketing purposes. We and some of our third-party providers may use cookie data for various purposes. Please review the cookie settings below and choose your preference.
Used for the proper function of the website
Used for monitoring website traffic and interactions
Cookie Settings
Cookies and similar technologies are used on this website for proper function of the website, for tracking performance analytics and for marketing purposes. We and some of our third-party providers may use cookie data for various purposes. Please review the cookie settings below and choose your preference.
Strictly Necessary: Used for the proper function of the website
Performance/Analytics: Used for monitoring website traffic and interactions
You reach out to all department heads and request to get data for your analysis: Marketing team for data on campaign conversion, customer support for data on call volumes, account team for data on customers feedback, product data for usage, etc. What is a product operations dashboard?
We will be using Airbyte (an open-source data integration platform) and Tableau (a business intelligence and analytics software) for this tutorial. Step 1: Replicating Zoom data to PostgreSQL Launching Airbyte In order to replicate Zoom data, we will need to use Airbyte’s Zoom connector.
But figuring out which sales tools you should buy and invest in – let alone what each tool even does – can be a daunting task. This is especially true when you consider the seemingly endless list of sales tools to choose from. Before we begin: how to choose your sales tools. Better tools, not more tools.
Or rather, two – conversation topics and custom reports. Well, my panel today are no strangers to asking that same question in conversations they have with each other, as they have been instrumental in our recent release of custom reports and conversation topics. Tanya Sivo: Hi, my name is Tanya Sivo and I’m a product designer.
As you’re researching customer analytics platforms, you’ve probably noticed how hard it is to find reliable information on the available solutions. TL;DR Customer analytics platforms are specialized tools that allow you to collect and analyze data. Starts at Tableau Viewer’s $15/month billed annually.)
The “shiny penny” approach (focus all your attention on the hottest tools in the market) or “head in the sand” approach (fall victim to analysis paralysis and avoid choosing any tools) are no longer viable. But here’s the thing: a tool is not a strategy. The anatomy of a marketing tech stack [with recommended tools].
Matching these solutions to the assorted challenges product managers face can be a little tricky, so we’ve done some digging to compile a handy list of product management tools. Data Analysis Tools for Product Management. Products can’t move forward without proper datavisualization and analysis.
When it comes to boosting your product growth, user tracking tools can make your life a lot easier. They offer insights into product performance , what your users are doing inside your product, and why they are doing it. But how do you know you’re picking the right tools? Tableau is the best user datavisualizationtool.
In SaaS, the top dataanalytics trends can either be a revolution or just fluff. So what are the trends in the dataanalytics landscape that are actually important for product management ?
Thanks to the abundance of tools out there, marketing has never been easier. In this article, we examine some tools that can help your SaaS team to drive product growth. We will also consider valuable examples of tools that can inspire your process. The best examples are Userpilot , Hotjar , and Google Analytics.
In 2019, industry-leading Business Intelligence tools (BI tools), Looker and Tableau, were acquired by Google and Salesforce for over $18 billion combined. These massive deals show that BI tools and data warehouses are a powerful combo that companies across the globe are incorporating into their tech stacks.
G2 has named Indicative as a Leader in Customer Journey Analytics in G2’s 2020 Summer Report. . Indicative is the only Customer Analytics platform designed specifically for non-technical business users that connects directly to your data warehouse. High Performer in Digital Analytics. Why We’re Leaders.
Key features of a modern agile analytics platform; how to truly democratize data and help biz users to create analytics at the “speed of thought” Hint: No IT-dependent centralized data-swamps No one in their right mind would think of filling out an IT ticket with requirements to make an Excel spreadsheet, right?
Tracking cross-platform analytics is essential for product teams to see a complete view of customer behavior. TL;DR Cross-platform analytics is the activity of tracking and analyzing user behavior across multiple platforms or devices. Tools like Google Analytics or Amplitude allow you to track user behavior across all platforms.
Do you need to worry about data discrepancy? More importantly, we will show you: How to identify them What causes data discrepancies And how to leverage product analyticstools to avoid the issue Let’s dive in! To identify data discrepancies, first cross-reference different data sources and look for inconsistencies.
In 2017, Gartner introduced the concept augmented analytics in his Augmented Analytics is the Future of Data and Analyticsreport. In broader terms, the concept can be defined as data preparation and presentation through the use of machine learning and natural language processing (spoken or written).
Below, we'll show you how to write the perfect data analyst resume. Highlight the most relevant projects that align with the goals of the data analyst role you're applying for. Highlight the most relevant projects that align with the goals of the data analyst role you're applying for.
Omnichannel analytics enable teams to get a 360 view of user behavior at different touchpoints of the customer journey. In particular, it covers: What omnichannel analytics are Why it’s important to track How to implement your omnichannel analytics strategy Omnichannel analyticstools Let’s get right into it!
In the age of data and analytics, we’ve come to believe that, with enough data, we can make smart decisions and become truly data-driven. But as the global data volume has gone from big to enormous, many businesses today find themselves thinking: What do we do with it? The “ABCs” of data.
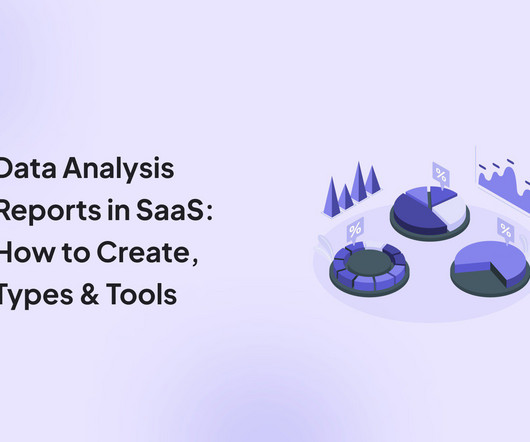
How do you create top-notch data analysis reports? It also covers: Why you need data analysis reports. Different types of reports. Best analyticstools for creating data analysis reports. Trend analysis reports track patterns and shifts in data over time.
The tools are constantly evolving and changing their pricing plans, so it may be difficult to ensure that your product team is using the right tools and getting the best value for the money. Roadmapping software visualizes and plans product development over time, facilitating coordination and alignment across teams.
Embarking on a career as a data analyst involves a combination of education, skills development, and practical experience. This guide will provide you with a comprehensive overview of the path to becoming a successful data analyst. Looking into tools for data analysts? Let’s dive in!
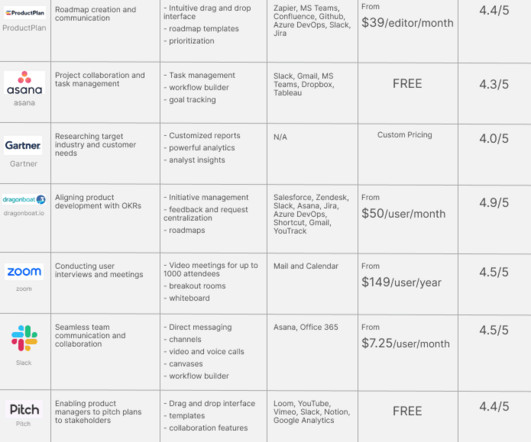
There are tons of specialized product management tools available today to solve some of your most frustrating challenges. Let’s look at the best tools for product managers and the problems they solve. So, we’ve gone ahead and compiled a handy list of the best product management tools, grouped by category.
In a response to an early draft of this series, Eric Peterson (co-founder of Automaton, previously at Tableau), made this astute observation: I wonder if instrumentation apprehension/paralysis is rooted in a fundamental lack of data literacy. The datasets we use, and the tools we use, often dictate what we view as possible.
Starting a career as a data analyst requires understanding the key steps, skills, and experiences needed for success. In this article, we will outline the typical journey for data analysts, covering educational requirements, entry-level positions, potential advancements, and long-term opportunities. Book a demo to see it in action!
Starting a career as a data scientist requires understanding the key steps, skills, and experiences needed for success. In this article, we will outline the typical journey for data scientists, covering educational requirements, entry-level positions, potential advancements, and long-term opportunities. Data Analyst (2-4 years) 3.
There were multiple sessions and discussions on modern practices, ways customers use and benefit from Atlassian tools. . Atlassian also used the event to share new announcements about their tools and platform. Atlassian intends to make Atlas the go-to tool for internal company updates. . Atlas — The New Teamwork Directory.
From understanding the analytics landscape to mapping capabilities with KPIs and integrating new tools with your current stack, we know that choosing a product analytics solution can be overwhelming—not to mention, time-consuming. How is Mixpanel different from marketing analyticstools like Google Analytics?
So before committing to Jupyter Notebook / Jupyter Lab, I did a quick survey of the state of the art in data notebooks—was there an up-and-coming alternative to Jupyter I should be looking at? The majority of their team are data scientists. R is widely used in agricultural data and particularly soil analysis.
Interested in data scientist roles? In this guide, we’ll explore the ins and outs of data scientist roles through detailed job descriptions and handy templates. Whether you’re hiring, job hunting, or simply curious, we’ve got you covered with practical insights and ready-to-use resources. Let’s dive in!
Make Sure Your Software Usage Analytics Solution Was Designed For the Job. Increasingly, they realize raw data isn’t enough: they need actionable insights for optimizing product development, increasing adoption, and growing sales. The solution has a name: software usage analytics.
How to Create a Tracking Plan for Your Products In my previous post on How to Use Data in Product Management , I talked about what is Quantitative and Qualitative data. (If Naming your events and actions The name for your events is critical to your data collection. There are multiple tools to do this.
Understanding the salary range for customer service representatives is crucial whether you’re entering the field or looking to advance your career. TL;DR A customer service representative is a professional who acts as a liaison between a company and its customers by providing helpful information and resolving emerging issues.
According to IDC, we’ll have 40 trillion Gigabytes of data by 2020. This year, the vast majority of our data will live in the cloud. “As As modern Product Managers, data should be your friend,” – says every CEO But this might sound easy but… What are the different types of data I need? How do I know what data to track?
Learning the tools essential for the role is also essential. Retention specialists can leverage platforms like Userpilot for understanding user journeys, ClientSuccess and ChurnZero for B2B customer success and churn prediction, Baremetrics for subscription analytics, etc. Looking into tools for retention specialists?
TL;DR Product market research involves collecting and analyzing data about potential customers, competitors, and market trends to ensure a product-market fit and drive customer loyalty. The choice between these depends on factors like your budget, time constraints, and whether you need exploratory data or definitive answers.
This is why we’ve been intentional in designing an analytics platform that becomes more valuable as more people and teams adopt it. Here’s a run-through of all the ways we’ve brought more collaboration to Mixpanel and why we think it’s so important for helping teams learn the most they can from their data.
TL;DR A customer advocate is a professional who represents the customer’s interests within a company, ensuring their needs and feedback are addressed to improve products and services. Use Data to Drive Decisions : Instead of relying on guesswork, leverage customer feedback and product analyticsdata to inform your product strategies.
Whether you’re hiring, job hunting, or simply curious, we’ve got you covered with practical insights and ready-to-use resources. A customer experience analyst job description outlines the essential duties, required skills, and qualifications necessary to deliver actionable insights. Let’s dive in!
This is why we’ve been intentional in designing an analytics platform that becomes more valuable as more people and teams adopt it. Here’s a run-through of all the ways we’ve brought more collaboration to Mixpanel and why we think it’s so important for helping teams learn the most they can from their data.
The problem The friend I talked to is named John. If you were an analyst, try applying to companies that build a product for analysts, like Tableau. I once met a guy named Brett on a flight to SF. Just your name, contact info, and maybe a few pieces of work. A reference makes a huge difference. Don’t know anyone?
Since talking to existing users wasn’t likely to yield new insights, we mainly targeted people that were not our customers. Ultimately, we ended up interviewing over 30 people, including product managers, product analysts, directors of product, data scientists, administrators and so on. Side note: Choosing names for personas.
It encompasses the gathering, analysis, and interpretation of data, which aids in identifying consumer demands, anticipating market trends, and staying ahead of the competition. It helps businesses gain broad insights when specific information is unknown. Gone are the days when just intuition or subjective judgment was enough.
This is why we’ve been intentional in designing an analytics platform that becomes more valuable as more people and teams adopt it. Here’s a run-through of all the ways we’ve brought more collaboration to Mixpanel and why we think it’s so important for helping teams learn the most they can from their data.
We organize all of the trending information in your field so you don't have to. Join 96,000+ users and stay up to date on the latest articles your peers are reading.
You know about us, now we want to get to know you!
Let's personalize your content
Let's get even more personalized
We recognize your account from another site in our network, please click 'Send Email' below to continue with verifying your account and setting a password.


Let's personalize your content