This site uses cookies to improve your experience. To help us insure we adhere to various privacy regulations, please select your country/region of residence. If you do not select a country, we will assume you are from the United States. Select your Cookie Settings or view our Privacy Policy and Terms of Use.
Cookie Settings
Cookies and similar technologies are used on this website for proper function of the website, for tracking performance analytics and for marketing purposes. We and some of our third-party providers may use cookie data for various purposes. Please review the cookie settings below and choose your preference.
Used for the proper function of the website
Used for monitoring website traffic and interactions
Cookie Settings
Cookies and similar technologies are used on this website for proper function of the website, for tracking performance analytics and for marketing purposes. We and some of our third-party providers may use cookie data for various purposes. Please review the cookie settings below and choose your preference.
Strictly Necessary: Used for the proper function of the website
Performance/Analytics: Used for monitoring website traffic and interactions
Without effective UX analytics that goes beyond collecting data, you’re losing valuable customers. Unfortunately, the research backs this up, with a staggering 90% of users reporting that they stopped using an app due to poor performance. It covers key topics, such as: Defining UX analytics. What is UX analytics?
While “use data to drive decision-making” sounds obvious, there’s a HUGE gap between saying it and doing it well. So, how do you get started with productanalytics ? In this article, we’ll talk about: What productanalytics is and why you need a solid strategy. What is productanalytics?
Think of Net Promoter Score (NPS) software as a tool to measure your customers’ feelings about your product, and categorize them based on their level of loyalty (promoters, neutrals, and detractors). The great advantage of these tools is that they streamline the creation, distribution, and analysis of NPS surveys.
Let’s review everything your customer success team has to do in the absence of any customer success tools. Collect customer data to calculate complex formulas for tracking metrics, monitor customer health scores, and resolve support tickets while continuously trying to improve retention and expansion.
Most product teams get mobile app analytics wrong. They track 47 different key performance indicators (KPIs) in their mobile analytics platform , spend hours debating dashboard numbers, yet can’t predict which users will churn next week The problem here isn’t a lack of data.
When your company adopts multiple SaaS solutions to drive productivity, you unknowingly create a perfect storm for data fragmentation. Your customer information lives in Salesforce, while your support tickets are in Zendesk, your product usage data in Mixpanel, and your marketing campaigns in HubSpot. Sound familiar?
You see, although we work hard to make Userpilot the best product adoption tool on the market, we know it isnt the perfect fit for every business. Helping prospects find the right product is a win-win situation. Userpilots key features include: No-code Chrome extension for building in-app flows.
When you’re building a mobile product , data is your lifeline. Whether for tracking feature adoption or spotting drop-off points, the right analyticstool can make or break your growth. Some tools are great for marketers, and others are for product or development teams.
You know your product collects tons of data. Datavisualizationtools help turn your messy spreadsheets into clear, interactive insights. The best ones dont even need SQL or data science skills. Because productanalytics should be easy and accessible for everyone, not just data experts.
Ever wonder why some products instantly click with users while others get abandoned faster than New Year’s resolutions? The secret often lies in those crucial first moments – your user onboarding. Well, when onboarding new users, that approach is about as effective as trying to fit everyone into the same pair of pants.
Its not just the design, features, or marketing. It’s what you do with the behavior data your app collects. And by behavior data, I dont mean installs (thats the easy part). I mean what happens after the download: how users navigate, what features they engage with, and where they drop off.
As you’re researching dashboardreportingtools, you’ve probably noticed how hard it is to find reliable information on the available solutions. TL;DR Dashboards display critical business data in real-time, streamlining decision-making and focusing on key metrics. Let’s dive in!
Guest Post by: Carlos Ruiz (Mentee, Session 11, The Product Mentor) [Paired with Mentor, Nis Frome]. Firstly, Jeff as a new umbrella brand for all the new services will be providing to our customers; Secondly, a new business line called Beauty Jeff was opening the very first venue in Argentina. Very task and feature- oriented.
With an abundance of productanalytics to track, having a robust SaaS KPIdashboard is essential to monitor the metrics that matter most. This guide will walk you through what it is, why you need one, and how to build your very own dashboard. What is a SaaS KPIdashboard? Usage monitoring.
Modern customers expect quick, personal, and effective service. This is where metrics can be invaluable, giving clarity on performance, and circumventing potential issues. But with so much data to consider, how can you define the help desk metrics that matter for your team? What are help desk metrics?
A customer expansion strategy is a playbook for increasing the revenue from your existing customers, for example, by selling them additional products and services or encouraging them to upgrade to higher plans. This metric helps SaaS companies track the effectiveness of their expansion efforts.
When you think of Whatfix, your mind probably goes to a digital adoption or an employee onboarding platform. Product teams can use a no-code editor to design step-by-step guidance and interactive elements that live directly inside their mobile apps. However, advanced behavior targeting requires a separate analytics integration.
Without measuring and aggressively improving the right mobile app metrics, youll struggle to stay afloat. This article will cover 14 metrics to help you achieve just that. Overview: Mobile app analyticsmetrics Below is a quick summary of the mobile metrics every PM should be tracking. The competition is stiff.
Whether it’s onboarding a new customer with well-timed guidance or re-engaging a user at risk of churn by helping them find value, getting the sequence of messages right requires a powerful, intuitive orchestration tool. Drive action across the customer lifecycle, all within a single tool.
Tracking user behavior analytics in mobile apps is a whole different challenge compared to the web. Without a global DOM or easy auto-capture tools, tracking mobile app user behavior takes more planning. And the behavioral data you do collect depends on what you choose to track and how you track it. Mobile analytics ?
Quantitative data alone doesn’t reveal intent, only outcomes. By combining contextual insights from session replays , heatmaps, and behavior analytics, user session analysis helps you interpret metrics through the lens of real user journeys. Tools can track every click and interaction.
I’m going to take a wild guess and assume that you already understand the importance of mobile in-app feedback tools. You also might be reading this post thinking: “Who’s adding new tools to their tech stack right now?” Do you have the right tools to capture that voice? Mobile in-app feedback tools & solutions.
Reporting vs. analytics – which should you choose for your business? While a growing number of businesses are increasingly adopting reporting and analytics , the difference between both terms can be confusing. Essentially, reports communicate information, while analytics provide context and insight.
As a product manager at Userpilot, I’ve had the chance (and let’s be honest, responsibility) to try out major onboarding automation tools in this space. In this post, I’ll walk you through how these tools compare based on actual, hands-on use, not just pricing tables and feature checklists.
What is an interactive product demo? An interactive demo is a self-guided walkthrough that uses tooltips, modals, hotspots, and other interactive elements to help users quickly explore your SaaS product. Why build interactive demos for your SaaS product? This results in faster Aha!
Are you tracking SaaS metrics without knowing how to make the analytics process easier? Analyticsdashboards are visualizationtools that give you an overview of key metrics. This makes it much easier to extract insights from your analysis compared to looking at mere numbers.
Nearly 60% of mobile teams still rely on self-hosted push tools. They trade short-term savings for long-term pain: no analytics, poor timing control, and zero personalization. This leads to errors like sending a product update notification at 1 AM or showing the wrong message to the wrong user segment. Lets get started.
Are you struggling to make sense of scattered user data? The right customer analytics platform helps you uncover exactly how customers interact with your product: so you can spot issues early, optimize user journeys, and drive sustainable growth. Choose the best fit for your needs and transform data into actionable strategies.
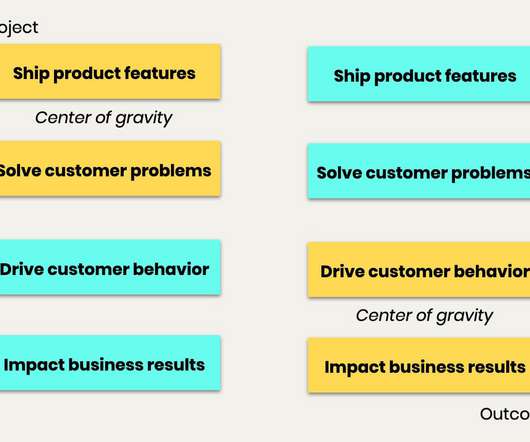
Our industry is in the midst of a big philosophical debate about the fundamental way of thinking about how we build our products, with the focus shifting from the outputs of what we build to the business outcomes generated by those outputs. The Product Impact Framework felt like a natural progression from features to outcome.
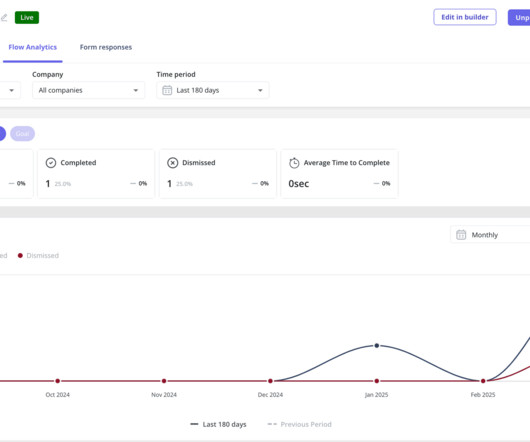
Are you wondering how the new Userpilot custom analyticsdashboards can help you drive product growth? In this article, you will learn about the main benefits of custom productanalyticsdashboards and how to create them in Userpilot. Userpilot is a robust analyticstool so you can use its own data.
In 2006, British mathematician Clive Humby made the infamous statement: Data is the new oil. Like oil, raw data needs to be refined, processed and turned into something useful because its value lies in its potential. Unfortunately, most people have yet to understand what it truly means to use data. The toughest challenge?
Reveal Embedded AnalyticsData-driven companies have a hidden advantage! Theyve consistently outperformed their counterparts, reporting significantly higher metrics across operational efficiency (81% vs. 58%) , revenue growth (77% vs. 61%), and employee satisfaction (68% vs. 39%). How is this possible?
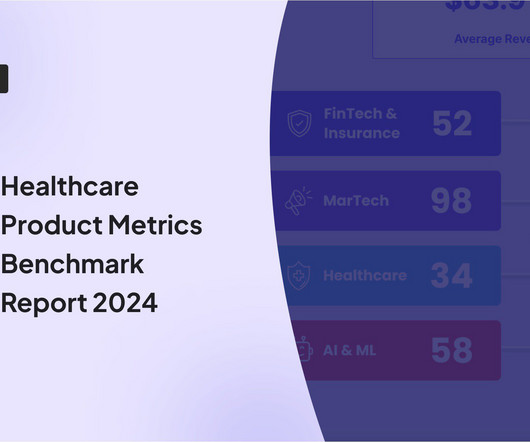
Userpilot’s SaaS ProductMetrics Benchmark Report has found that compared to other industries, healthcare SaaS companies perform lower across most of the 6 metrics we studied. You will also learn how healthcare companies can improve their productmetrics. Onboarding checklist completion rate.
In SaaS, a customer onboardingdashboard can become a massive productanalyticstool to understand and optimize the user journey. But what type of dashboards can you use to analyze your onboarding process? Let’s explore how a customer onboardingdashboard works and see different examples.
What happens when you build a product or service around what you think potential customers want, only for them to buy something else? But worse than that, it leads to lower revenue, failed products, and plummeting customer loyalty. Does customer research help build better products? The short answer: yes.
A self-servicedata platform is the backbone of informed decision-making and a growing SaaS business. But how do you choose the right data platform for productanalytics ? Let’s go over what a data platform is, its importance, and the must-have features you should consider to choose the right platform for you.
Performance reporting is essential for product and project managers to make data-driven decisions. TL;DR Performance reporting is the process of collecting , analyzing, and presenting data on product or project performance. It allows teams to identify areas for improvement and make data-driven decisions.
You have the analyticsdata, but it doesn’t tell the whole story. This powerful tool allows you to see your website or web app through your users’ eyes. It reveals the “why” behind their actions and unlocks valuable insights to improve the user experience. How do session replay tools come in?
A product adoption dashboard helps you visualize key adoption metrics so you can make data-driven decisions and boost user engagement. In this article, we cover the following: Why you need a product adoption dashboard. Steps to measure adoption using a comprehensive dashboard.
Guest Post by: Vivek Karna (Mentee, Session 11, The Product Mentor) [Paired with Mentor, John Masterson]. As I strive towards becoming a product leader, I wanted to understand the best practises in product management and in the process develop my own product philosophy. . Introduction. Understanding the Role Definition.
In SaaS, a new user activation dashboard can become a massive productanalyticstool to understand and optimize the user journey. But how can a dashboard for user activation can help you engage more users? moment ," where the core value proposition of your service becomes clear and tangible.
Whether you’re introducing a new product, releasing an upgrade, or announcing advanced features, outlining a product launch strategy can help align your efforts in the right direction. The key is to monitor all the data and optimize your strategy at each step. That’s where product launch analytics step into the picture.
In a fast-paced industry like SaaS, leveraging business analytics effectively can be the key to staying competitive and driving product growth. Business analytics offers invaluable insights that help SaaS companies optimize operations, enhance customer experiences, and make data-driven decisions.
If youve ever tried evaluating product tour tools, you know the surface-level comparisons dont tell you much. Every tool claims to be a no-code tool and easy to use, but few support the workflows product teams care about, like multi-step onboarding , flow targeting, mobile support, or analytics that go beyond step views.
We organize all of the trending information in your field so you don't have to. Join 96,000+ users and stay up to date on the latest articles your peers are reading.
You know about us, now we want to get to know you!
Let's personalize your content
Let's get even more personalized
We recognize your account from another site in our network, please click 'Send Email' below to continue with verifying your account and setting a password.


Let's personalize your content