This site uses cookies to improve your experience. To help us insure we adhere to various privacy regulations, please select your country/region of residence. If you do not select a country, we will assume you are from the United States. Select your Cookie Settings or view our Privacy Policy and Terms of Use.
Cookie Settings
Cookies and similar technologies are used on this website for proper function of the website, for tracking performance analytics and for marketing purposes. We and some of our third-party providers may use cookie data for various purposes. Please review the cookie settings below and choose your preference.
Used for the proper function of the website
Used for monitoring website traffic and interactions
Cookie Settings
Cookies and similar technologies are used on this website for proper function of the website, for tracking performance analytics and for marketing purposes. We and some of our third-party providers may use cookie data for various purposes. Please review the cookie settings below and choose your preference.
Strictly Necessary: Used for the proper function of the website
Performance/Analytics: Used for monitoring website traffic and interactions
Without effective UX analytics that goes beyond collecting data, you’re losing valuable customers. Unfortunately, the research backs this up, with a staggering 90% of users reporting that they stopped using an app due to poor performance. It covers key topics, such as: Defining UX analytics.
Think of Net Promoter Score (NPS) software as a tool to measure your customers’ feelings about your product, and categorize them based on their level of loyalty (promoters, neutrals, and detractors). The great advantage of these tools is that they streamline the creation, distribution, and analysis of NPS surveys.
You can gather all the user feedback or behavioral data you want or even generate tons of Google Analyticsreports. Despite all these efforts, you’re probably still not acting on product analytics correctly. Why actionable product analytics are important. This causes siloed data and integration issues.
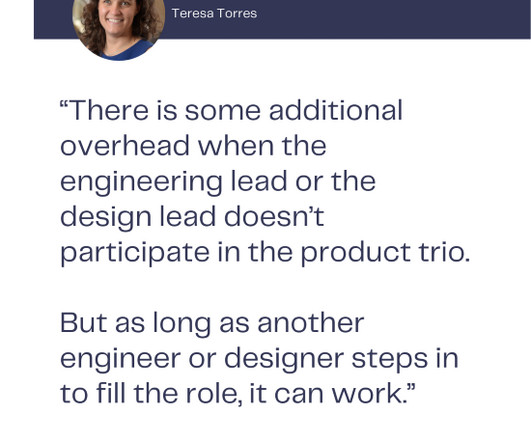
Ask Teresa: Does the engineer in a product trio need to be the tech lead? In the past, I’ve sometimes used language like “design lead” or “tech lead” to refer to the design and engineering members of the trio. So let’s take a closer look at what I mean by the term “tech lead” and how you can apply this to your own team.
Speaker: Patrick Dempsey and Andrew Erpelding of ZoomInfo
Find and connect with the right talent to fill roles fast with these tools: More data! Advanced search: Narrow the search to find candidates using specialized filters like education, and current company technologies. We have added 10's of millions of personal emails and mobile records.
Drawing from his 20+ years of technology experience and extensive research, Nishant shared insights about how these activities vary across different organizational contexts – from startups to enterprises, B2B to B2C, and Agile to Waterfall environments.
When your company adopts multiple SaaS solutions to drive productivity, you unknowingly create a perfect storm for data fragmentation. Your customer information lives in Salesforce, while your support tickets are in Zendesk, your product usage data in Mixpanel, and your marketing campaigns in HubSpot. Sound familiar?
New research from Harvard Business ReviewAnalyticServices reveals that businesses of all sizes – from small businesses to enterprises – are realizing the business value of personal, efficient customer engagement. Below, we take a deeper dive into the report’s key data and trends. But they’re facing big barriers.
Let’s review everything your customer success team has to do in the absence of any customer success tools. Collect customer data to calculate complex formulas for tracking metrics, monitor customer health scores, and resolve support tickets while continuously trying to improve retention and expansion.
How product managers can use AI to get more actionable insights from qualitative data Today we are talking about using qualitative data to drive our work in product and consequently improve sales. Before founding Viable, he held senior leadership roles in engineering, technology, and product.
You know your product collects tons of data. Datavisualizationtools help turn your messy spreadsheets into clear, interactive insights. The best ones dont even need SQL or data science skills. Because product analytics should be easy and accessible for everyone, not just data experts.
From surfacing hidden landmines during duediligence to bringing entire product orgs under one cohesive vision, Brians got the battle scarsand the winsto prove it. Below, well unpack his real-world advice on making acquisitions work, retaining your best people, and aligning tech stacks for a post-merger world that actually innovates.
James shares insights from his research studying companies that consistently launch successful products. James shares that many teams are now working with their second or third generation of AI tools, particularly in sales and marketing.
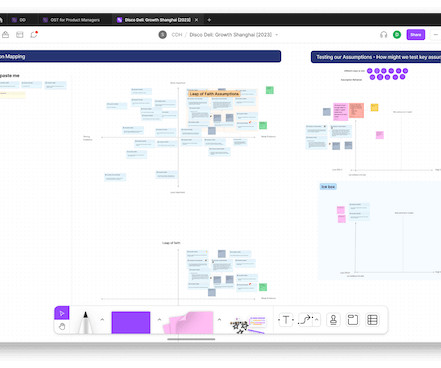
The opportunity solution tree helps visualize all the work that goes into continuous discovery. And while opportunity solution trees have become increasingly common among product teams, there’s still plenty of room for customization, both in the way you set up your trees and the tools you use to build them.
How product managers are transforming innovation with AI tools Watch on YouTube TLDR In this deep dive into AI’s impact on product innovation and management, former PayPal Senior Director of Innovation Mike Todasco shares insights on how AI tools are revolutionizing product development.
You see, although we work hard to make Userpilot the best product adoption tool on the market, we know it isnt the perfect fit for every business. Robust resource center functionalities for offering self-service help. Custom dashboards to track key metrics at a glance. for collecting user sentiment data.
Most product teams get mobile app analytics wrong. They track 47 different key performance indicators (KPIs) in their mobile analytics platform , spend hours debating dashboard numbers, yet can’t predict which users will churn next week The problem here isn’t a lack of data.
This post is about making these ideas concrete through a set of guidelines, templates, and JIRA+Excel tips so you can create effective status and progress reports quickly, have less meetings , and get out of the building , which is where you need to be. Sometimes, we just need to report back on what we’ve been up to.
Case Study: Improving Data-Driven Decision Making for CSR Leadership Civian is a data-driven platform designed to help businesses measure, optimize, and showcase the social and economic impact of their investments in communities. Feature Engagement Users most frequently gravitated toward the map to explore and compare data.
Note that Ive decided not to state the names of the tools I found, partly as the AI landscape is changing rapidly and partly as you should research and select the tools that work best in your context rather than trusting my judgment. [2] 2] Market Research AI-based tools can discover user and customer trends using predictiveanalytics.
Below is a preview of key insights. Shift from fixed yearly planning to rolling quarterly reviews to allow flexibility in roadmap decisions. Make switching easier Allow parallel use with existing tools and automate data migration from competitors. Create a self-initiated MVP even a simple landing page or automation tool.
I’m going to take a wild guess and assume that you already understand the importance of mobile in-app feedback tools. You also might be reading this post thinking: “Who’s adding new tools to their tech stack right now?” Do you have the right tools to capture that voice? Mobile in-app feedback tools & solutions.
But in today’s fast-paced world, your customer support can only be as effective as the technology that underpins it. Study after study shows that the vast majority of support teams are unhappy with their current customer support tech stacks. Download The Ultimate Modern Support Tech Stack guide. Is your tech stack ready?
Similarly, the opportunity solution tree can be an incredibly powerful tool for keeping track of your desired outcome , the opportunities you learn about during discovery, the solutions you’re considering for each opportunity, and the experiments you’ll run to assess your ideas. It’s about finding the tech stack that works for your team.
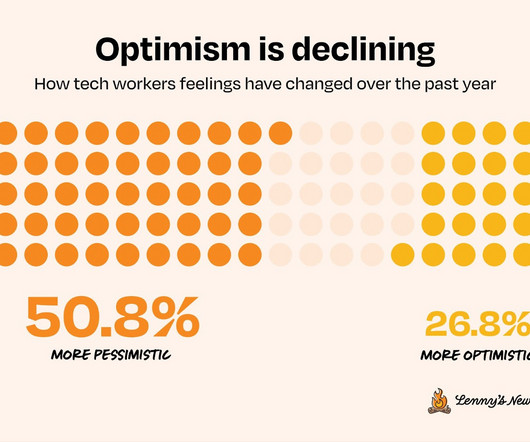
Today, with insights from over 8,200 of you (thank you to everyone who participated!), we’re excited to share the results of our first-ever large-scale tech worker sentiment survey. What we discovered is that tech professionals are experiencing a fascinating mix of emotions about their careers in 2025. Subscribe now.
The collaboration between AMS and MIT researchers has yielded impressive results, with AI tools not only matching human analysts in identifying customer needs but often exceeding themespecially for emotional needs that humans might overlook. But it is changing, with AI tools that are transforming how we uncover and analyze customer needs.
The following data and information on Business Services apps is from our 2022 Mobile App Customer Engagement Report. Brands in Business Services had varied experiences in 2021. Below is a short summary of how Business Services apps fared in 2021. Data included: Ratings and reviews.
Relative to other standard roles defined in an organization such as Ops, Marketing, Tech etc., Often, this is due to resource constraints rather than a lack of understanding of a PM role. A well defined product strategy provides insights into the deep customer problems that your product is trying to address. Data vs Intuition.
In this Whatfix Mobile review, youll find answers to three questions: What does Whatfix Mobile offer? Whatfix delivers context-aware guidance that helps users correctly complete sensitive tasks like handling patient documents, uploading payroll data, etc., However, advanced behavior targeting requires a separate analytics integration.
From premature optimization to over-engineering solutions for your product, it’s easy to get caught up in making technology decisions that slow you down instead of speeding you up. So when it comes to building your technical strategy, you need to assess each component in relation to what success will look like for your business.
It gives you the ongoing, actionable insights you need to grow market share, secure stakeholder buy-in, and optimize your brand strategy. According to Gartner®, while 57% of brand leaders conduct brand health assessments, only 21% find those insights actionable. That’s where brand health tracking comes in.
From Raw Data to Clarity — Cleaning, Sorting, and Synthesising Insights Part 4 (of 5) of the UX Research Playbook series Synthesising qualitative data is similar to reaping the harvest after the diligent effort poured into research — it’s the step where hard work blossoms into meaningful insights. is recommended.
Firstly, Jeff as a new umbrella brand for all the new services will be providing to our customers; Secondly, a new business line called Beauty Jeff was opening the very first venue in Argentina. Challenges due to hypergrowth. Regarding MVP delivery: Term was out there, not clear the scope Delivery blocked due to complex solutions.
The payoff is already visible in richer digital experiences, sharper personalization and faster, safer service. Within this article, we analyze how AI’s adoption in 2024 impacted key areas of digital CX, highlighting global trends as well as specific insights from major markets like the US and UK.
Do you have the right tools to capture that voice? To help you with this, we compiled a list of the top mobile in-app feedback tools of 2021. Incorporating these tools into your customer experience tech stack will drive more engagement, gather high-quality customer feedback, and help inform your product roadmap.
90% of the world’s data has been created in the past 2 years, and businesses spend more than $180 billion annually on big dataanalytics. Since our first ancestors began writing on parchment, data has been an integral part of the human experience. What is big dataanalytics? But how is it used?
Reveal Embedded Analytics We know how difficult it is to create dashboards, especially for web applications. However, running business operations or targeted campaigns without insights into their effectiveness is not an option. Thats what dashboards are for. It offers several options when it comes to dashboard libraries.
Quantitative data alone doesn’t reveal intent, only outcomes. By combining contextual insights from session replays , heatmaps, and behavior analytics, user session analysis helps you interpret metrics through the lens of real user journeys. Tools can track every click and interaction.
Subcategories: Restaurant, Food Services. In our 2022 Mobile Customer Engagement Benchmark Report , a study of more than 1,000 apps across a billion mobile app installs, we take a close look at apps in the Food and Drink category. Data included: Ratings and reviews. Download the full 2022 Benchmark Report here.
From healthcare providers to insurers and others, the pandemic is rapidly driving organizational change and prompting businesses to consider future needs by adopting new technologies to replace or assist with historically manual workflows without compromising on care or privacy. What is HIPAA? Ongoing commitment.
To better understand the common challenges organizations face with digital feedback tools, we conducted a comprehensive market research study that revealed several critical pain points. When one tool gathers feedback via email and another through your website, consolidating all that data and customer feedback can be nearly impossible.
In 2006, British mathematician Clive Humby made the infamous statement: Data is the new oil. Like oil, raw data needs to be refined, processed and turned into something useful because its value lies in its potential. Unfortunately, most people have yet to understand what it truly means to use data. moment that makes users stick.
Read on to learn how, through collecting and analyzing their operational data, a team was able to quantify and improve their processes on the path to being able to establish clear release plans for the project. There was no data available to track or predict the actual scope of a sprint. THE CHALLENGE. Long standups.
We organize all of the trending information in your field so you don't have to. Join 96,000+ users and stay up to date on the latest articles your peers are reading.
You know about us, now we want to get to know you!
Let's personalize your content
Let's get even more personalized
We recognize your account from another site in our network, please click 'Send Email' below to continue with verifying your account and setting a password.


Let's personalize your content