This site uses cookies to improve your experience. To help us insure we adhere to various privacy regulations, please select your country/region of residence. If you do not select a country, we will assume you are from the United States. Select your Cookie Settings or view our Privacy Policy and Terms of Use.
Cookie Settings
Cookies and similar technologies are used on this website for proper function of the website, for tracking performance analytics and for marketing purposes. We and some of our third-party providers may use cookie data for various purposes. Please review the cookie settings below and choose your preference.
Used for the proper function of the website
Used for monitoring website traffic and interactions
Cookie Settings
Cookies and similar technologies are used on this website for proper function of the website, for tracking performance analytics and for marketing purposes. We and some of our third-party providers may use cookie data for various purposes. Please review the cookie settings below and choose your preference.
Strictly Necessary: Used for the proper function of the website
Performance/Analytics: Used for monitoring website traffic and interactions
A close look at key performance indicators (KPIs) and the impact they have on the efficacy of UserExperience (UX). A great understanding about how KPIs can inform your UX research on both a qualitative and quantitative level.
You’ll find yourself working closely with UX and UI designers throughout your career as a Product Manager. The last thing you want to do when talking to a designer, is to use UX and UI interchangeably. Or that an OKR is the same as a KPI. You may also be interested in: Why UX Is Essential for PMs What Is UX?
Do you need some behavioral KPI examples to understand what metrics to track and why? Behavioral key performance indicators (KPIs) can help you understand userexperience and measure feature adoption. Tracking behavioral KPIs is essential for understanding customers and improving their userexperience with your products.
Userexperience is the concept of gauging the satisfaction or frustration of your users while they interact with your product/service. Optimizing the user’sexperience throughout their journey is one of the best ways to improve your brand image and secure lasting engagement.
UXKPIs, or userexperience key performance indicators, are essential numerical data points that are used to track, measure, and compare the experienceusers have with your SaaS product. Userexperience (UX) involves all aspects of user interactions with your product.
Example of anOKR: Objective: Improve the userexperience of the checkoutprocess. Key Performance Indicators (KPIs) KPIs are ongoing performance metrics used to track the health and effectiveness of a product or design. better UX higher conversion increased revenue). Are you reducing friction?
With no-code user onboarding tools , it’s easy to start building onboarding journeys that don’t reflect reality—all in a vain attempt to get new users to activate faster so they don’t churn. Userexperience journey mapping makes us ask this question: How do users move through their own goals, not our hoops?
Product managers are aware of the basic KPI metrics to measure for their mobile app, but there are a handful of underestimated KPI metrics that product managers need to measure as well. An important KPI metric to focus on here is the average time between each consecutive step.
Top KPIs in organizations might include sales revenue, customer value, conversion rates, inbound marketing ROI, and site traffic to name a few. For decades, userexperience professionals have been debating how to associate experience measures with these key KPIs. View it today. About the webinar speaker.
Make UX A Part of the KPI Conversation With Universal Measures. Make UX A Part of the KPI Conversation With Universal Measures Key Performance Indicators or KPIs are basic measures that are often front in center in most board rooms. ON-DEMAND WEBINAR. About the webinar speaker.
New features, improving performance and addressing UX issues can’t be ignored in order to please the loudest voice in the room. At FreeAgent, as soon as a KPI goes red, a team can switch off whatever they’re doing and divert resource to fix it. Product considerations must still be looked at.
Validating one with the other gives you the whole picture and confidence to make decisions that improve usersexperience. Use these methods to collect qualitative data: In-app surveys : A tool like Userpilot lets you trigger surveys in your mobile app based on user behaviour and collect contextual feedback with logic conditioning.
As companies usually have many different KPIs, maintaining or growing customer retention is a key KPI that each business commonly shares. You might also be interested in Mobile app KPI dashboard examples and how to use them What is customer retention and why is it so important? a leading Buy Now, Pay Later solution.
What are the top challenges that UX professionals will face in 2020 and what can we do to solve them? Over the last couple of years we’ve surveyed hundreds of people from some of the biggest companies in the world to discover the current UX landscape in enterprise organizations.
A crew’s happiness is directly related to the quality of their outputs and so is measured as any other KPI would be. Within their design tribes, UX + UI + Research means you are a full stack designer. At Moo, tribes are collections of crews who focus on particular problems. The Skills That Designers Need.
To calculate: Activation rate Measures the percentage of users who get to their first “aha” moment. To collect the data to measure this KPI, you need to define what activities make up an “aha moment.” You can identify those activation points by figuring out what your most successful user cohort accomplished before they subscribed.
Having trouble deciding which customer service KPI to use? There are some vanity metrics among the KPIs for customer service. So let’s look at the most important KPIs that will help you create strategies to provide superior customer service and boost retention. Customer service KPI #1 Customer Satisfaction Score.
At the start of 2017 I made several predictions about UX design and research. Organizational UX maturity grew across the board. A lot of organizations that we work with have hired senior UX leaders. 2) Measuring KPIs and conducting Competitive Benchmarks to demonstrate strategic value. Let’s see how I did.
10 Customer retention KPIs and metrics to measure retention. Here are 10 of the most important KPIs and metrics that help you measure customer retention rate. Retention KPI #1 Customer retention rate. Customer retention rate is the percentage of users who continued to use your product after their initial purchase.
There are various formats and designs to help you build a solid vision, including the Lean UX Canvas by Jeff Gothelf and the Business Model Canvas by Alexander Osterwalder. A key result is not the same thing as a KPI (key performance indicator). A KPI is used to measure the continued progress towards a defined performance measure.
UserExperience is a key factor regarding the success of a digital product, and the main ingredient to an excellent UX lies in a thorough user-centered approach. In other words, it is crucial to a product's success to consider who the users are, as well as their motivations and goals. What is a UX Audit?
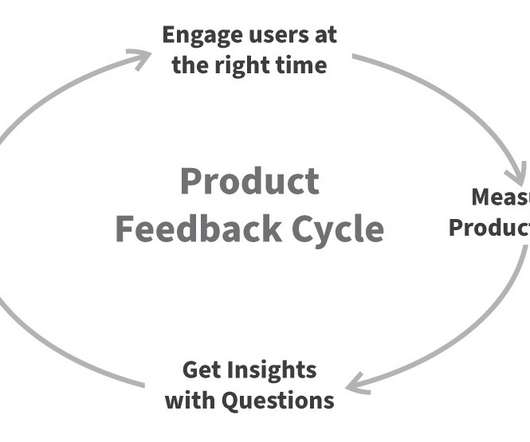
Looking to build better userexperiences? It’s time to stop passively observing your analytics and start engaging your users. Here is why user engagement is the new key to build innovative experiences. It all starts with user feedback. And it doesn’t involve tracking every action your users do.
Best way to track and measure product management KPIs. Product management KPIs help product teams outline and track the business or product success. KPI stands for Key Performance Indicator, and OKR stands for Objectives and Key Results. What’s the difference between KPIs and OKRs? Let’s get started!
Great userexperience matters for digital experiences across all industries yet many websites catering to the health insurance market fall short. Digging into the data, California stands out as an interesting case of not taking the first KPI as a win. Compare healthcare plans and select one that will meet your needs.”.
Participate in every aspect of product design (not talking about just UX/UI here), but this subtle distinction is key to not lose focus on the big picture. Long term, you can expect to manage a specific KPI (e.g., improve first userexperience, reduce churn, etc.), That’s the best way to get your hands dirty in the game.
OKRs are different from KPIs because a KPI is strictly a metric that reflects performance. There are two main performance frameworks in product marketing – OKRs and KPIs. Meanwhile, a KPI is a single metric that gives a reflection of performance in one area. Grow Monthly Active Users (MAU) by 12%.
This role is pivotal in creating the most engaging creative tools for users, with a focus on drawing, playing, and the innovative use of generative AI. Youll blend the strategic mindset of a growth product manager with the creative vision of a UX designer – driving repeat engagement, gamification, and social participation.
PMMs use product analytics to gain actionable insights into their customers' experiences, understand what's driving success and what's causing friction in the user journey to help the customer achieve repeated value by using the product. KPI and other custom-built dashboards. User property attachments.
Product challenges Product health metrics are one of the most important KPI sets to track when running SaaS businesses. Product experience The term product experience (PX) may not be as popular in the SaaS industry as userexperience (UX), but it’s equally important.
This is a guide for UX and research practitioners who have either newly joined an organization that’s using the Agile methodology, or their current product development is adopting Agile for the first time and they’ve been told to “make UX research happen in this new fangled process immediately please!” . This is a false economy.
There’s no single KPI to measure customer satisfaction. However, the most relevant include: Customer satisfaction score ( CSAT ): the percentage of users who report being satisfied with a product, service, or specific interaction. What is the KPI for customer satisfaction?
In this article, we will cover the essential app metrics for: Product managers UX/UI designers Growth marketers iOS and Android developers Backend developer Found yourself on this list? However, metrics play a significant role in understanding the satisfaction level of users. Then let’s dive deeper into each of the positions.
The main difference is that customer success OKRs set the direction for CS strategies, while CS KPIs measure progress against customer success OKRs. Thus, an OKR could be “launch customer engagement initiatives,” and the relevant KPI could be “10%+ growth of engaged customer views per month.”
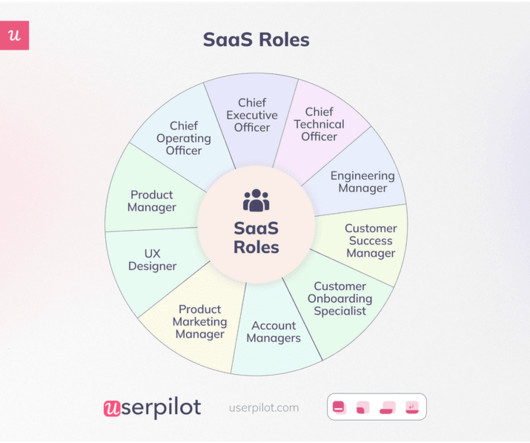
UX Designer: Responsible for understanding the unique needs and requirements of SaaS users and designing the user interface and experience of SaaS products. For example, a startup might not need a sales manager or a fully-fledged sales team in its early days, but a UX designer is an absolute necessity.
Ten of the most important SaaS KPIs are the Customer Acquisition Cost, Customer Lifetime Value , Lead Velocity Rate , Trial-to-Paid Conversion Rate , Monthly Recurring Revenue, Customer Churn Rate , Annualized Contract Value , Expansion Revenue MRR , Net Promoter Score , and the SaaS Quick Ratio. Leading KPIs.
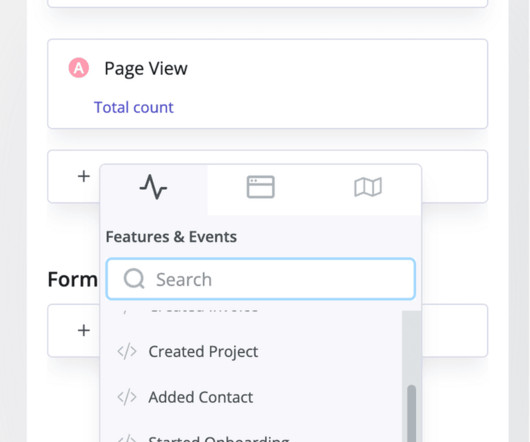
By examining trends reports, you can see the rise and fall of each KPI, allowing you to spot abnormalities easily. This report is particularly useful when you make changes to your product or conduct an experiment and want to see how it impacts results. Funnel analysis report. Features and events dashboard in Userpilot.
Product adoption is an important KPI for product teams because it impacts customer lifetime value and other key metrics. Troubleshooting : Address issues and questions as they come up and make sure users feel they are resolved. Satisfaction : Focus on ways to cultivate good experiences early on in the process.
As this Venn diagram shows, being “data-informed” means you operate at the intersection of pure data, your own gut feeling — which is a pretty powerful and educated tool you have as a product person — and everything else, including design thinking, qualitative data, user research, and userexperience tools and workshops.
Product experiments CAN and WILL improve your customer activation rates, engagement levels and ultimately user retention – so if you’re not doing them, you’re leaving money on the table. Why Product Managers Need Product Experiments. Goal Setting For Product Experiments. Don’t just carry out single tests.
Running experiments adds a structured approach to discovering unbiased learnings and uncovering the real cause to changes in metrics, even when they are too small to be measured independently. Why do you need to run Experiments? ? Experimentation reduces that noise and allows drivers of change to be readily identifiable. ?
As many as 80% of your users will skip your product tour if it consists of more than 5 steps! The more personalized the userexperience, the more your customer feels special – like you care about their individual needs. But all users need to know how to create boards and tasks. They lack personalization.
Sign-up-to-customer rate – the rate of the users who have turned from free trials to the paid versions. Another solid KPI is to track the success of how many users actually use the product and get to the activation point. Users who experience the value of the product firsthand are more likely to convert to paying users.
But to make actionable these metrics actionable, you need to understand the specific milestones the user needs to hit to in each of the stages to count as ‘aquired’, ‘activated’, ‘retained’ etc. It’s a long article though, so here is a TLDR; summary of what we had to say there: Analyze Your Users’ Behaviour. Session recording tools.
We organize all of the trending information in your field so you don't have to. Join 96,000+ users and stay up to date on the latest articles your peers are reading.
You know about us, now we want to get to know you!
Let's personalize your content
Let's get even more personalized
We recognize your account from another site in our network, please click 'Send Email' below to continue with verifying your account and setting a password.


Let's personalize your content