article thumbnail

User Activation Rate Benchmark Report 2024

Userpilot

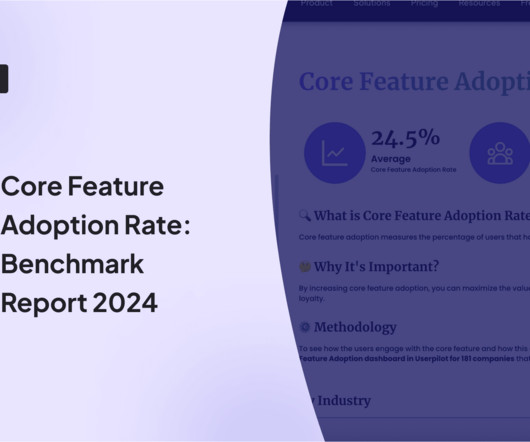
That’s one of the questions about user activation rates that we explore in our Product Metrics Benchmark Report 2024. Companies analyzed in the Product Metrics Benchmark Report by industry. The average activation rate across the companies we studied for our SaaS Product Metrics Benchmark Report was 37.5. Book the demo!

article thumbnail

Introducing our product benchmarking report

Mind the Product

To support you in this endeavor, we’ve developed a comprehensive benchmark report that allows you to evaluate your product KPIs against those of other organisations.

Insiders

Sign Up for our Newsletter

This site is protected by reCAPTCHA and the Google Privacy Policy and Terms of Service apply.

article thumbnail

MarTech Success Metrics Benchmark Report 2024

Userpilot

MarTech companies had the lowest onboarding c completion rates of all the industries we studied for our SaaS Product Metrics Benchmark Report. Companies by industry analyzed in our Product Metrics Benchmark Report 2024. Key findings from the report about MarTech companies include: Average customer activation rate : 24%.

article thumbnail

Customer Onboarding Checklist Completion Rate: 2024 Benchmark Report

Userpilot

These are the key questions we explore in the article based on our recent Product Metrics Benchmark Report 2024 which investigates company performance in 6 different metrics across 7+ industries. Companies analyzed in the SaaS Product Metrics Benchmark Report 2024 by industry. Check out our Product Metrics Benchmark Report 2024.

article thumbnail

2020 Database Strategies and Contact Acquisition Survey Report

This report aims to highlight the current state of B2B database and contact acquisition strategies and organizations’ goals to leverage data to fuel their go-to-market strategies in 2020 and beyond. As buyer expectations to receive this type of relevant engagement continues to heighten, database management strategies are of high importance.

article thumbnail

Core Feature Adoption Rate: Benchmark Report 2024

Userpilot

That’s the average core feature activation rate across the companies we studied for our Product Metrics Benchmark Report 2024. Companies by industry analyzed in our Product Metrics Benchmark Report 2024. Check out our Product Metrics Benchmark Report 2024. Userpilot ’s retention report. respectively). Book the demo!

article thumbnail

Introducing: 2022 Mobile Customer Engagement Benchmark Report

Alchemer Mobile

This report contains data from the following app categories: Finance. Download a complimentary copy of the report now to see how your app performed against the marketplace and to help set new, data-backed engagement goals for 2022. The post Introducing: 2022 Mobile Customer Engagement Benchmark Report appeared first on Apptentive.

article thumbnail

Forrester Research Report: How Sales and Marketing Intelligence Drive Improved Business Outcomes

Those implementing a B2B sales and marketing intelligence solution reported that they have realized 35% more leads in their pipeline and 45% higher-quality leads leading to higher revenue and growth. However, organizations are fighting back - and winning.

article thumbnail

How Embedding AI-Powered Analytics Can Give You a Competitive Advantage

Embedding dashboards and reports aren’t enough. Futureproof your application by offering instant, actionable insights that will give you and your customers a competitive advantage.

article thumbnail

Optimize Your Product Team to Win in the Market

Accenture’s Return on Learning study reported that training can yield an impressive 353% ROI through skills improvement. Download 280 Group’s Global Product Management Skills Benchmark Report to learn how skill improvement yields faster results on optimizing your product function. Double down on skills.

article thumbnail

What is Data Storytelling? The Value of Context and Narrative

This blog acts as a beginner’s guide to what data storytelling means for your company’s business intelligence and data analytics, explains the importance of leveraging it today, and illustrates how Yellowfin’s own set of storytelling tools can enrich your insight reporting efforts.

article thumbnail

How to Get Promoted – Climbing the Product Management Ranks

According to 280 Group’s Global Product Management Skills Benchmark Report, certain skills directly impact your career trajectory, and therefore, your earning potential. The report uncovers which core product management skills are critical to helping you stand out against your peers and moving up the ranks.

article thumbnail

How to Select an Embedded Analytics Product: 12 Criteria to Consider

This report is designed to help readers select an embedded analytics product. It provides 12 criteria to consider when evaluating embedded capabilities. It also comes with a companion spreadsheet that enables users to score and compare products along these 12 dimensions and others they may add.

article thumbnail

The ABM Benchmark Survey

In a recent survey with Demand Gen Report, we found 59% of experienced practitioners (those with ABM programs more than a year old) indicated their ABM programs are meeting or greatly exceeding their expectations, while only 45% of novices (those with ABM programs less than one year old) could say the same.

article thumbnail

Trends in Embedded Analytics

Download the report to learn how embracing embedded analytics can unlock new markets, revenue growth, and heightened levels of customer satisfaction for your digital product. Did you know that the embedded analytics and business intelligence market is expected to reach a $1.3 billion value in 2023?