This site uses cookies to improve your experience. To help us insure we adhere to various privacy regulations, please select your country/region of residence. If you do not select a country, we will assume you are from the United States. Select your Cookie Settings or view our Privacy Policy and Terms of Use.
Cookie Settings
Cookies and similar technologies are used on this website for proper function of the website, for tracking performance analytics and for marketing purposes. We and some of our third-party providers may use cookie data for various purposes. Please review the cookie settings below and choose your preference.
Used for the proper function of the website
Used for monitoring website traffic and interactions
Cookie Settings
Cookies and similar technologies are used on this website for proper function of the website, for tracking performance analytics and for marketing purposes. We and some of our third-party providers may use cookie data for various purposes. Please review the cookie settings below and choose your preference.
Strictly Necessary: Used for the proper function of the website
Performance/Analytics: Used for monitoring website traffic and interactions
I’m going to take a wild guess and assume that you already understand the importance of mobile in-app feedback tools. You also might be reading this post thinking: “Who’s adding new tools to their tech stack right now?” Do you have the right tools to capture that voice? Mobile in-app feedback tools & solutions.
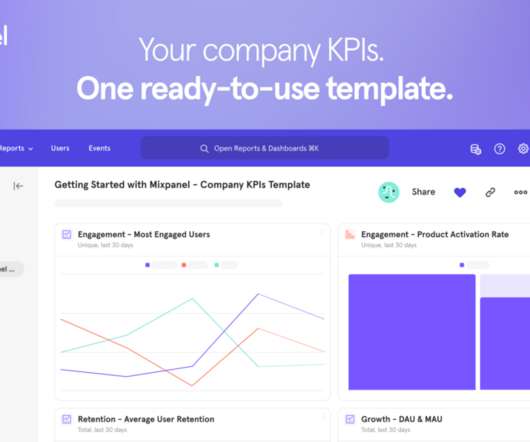
Learn about the importance of mobile app KPI dashboards and copy dashboards from real mobile app product managers, engineers and designers. A key performance indicator (KPI) dashboard is a visual representation of data that quantifies how well a team is performing towards its goals.
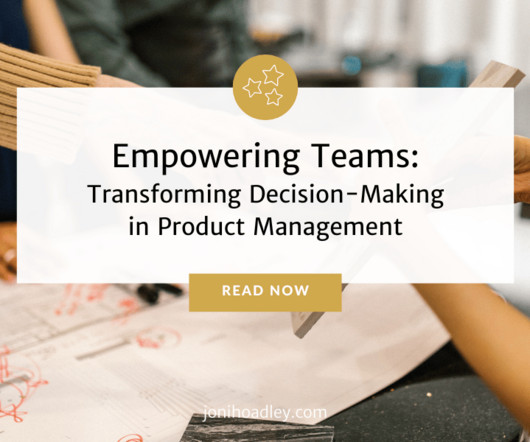
The Price of Decision-Making Challenges In a 2022 survey conducted by Airfocus , 56.4% Even more startling, product managers reported spending 45% less time on strategy than theyd like in 2023. Use this insight to refine your approach. As leaders, we cant ignore these realities but we can change how we respond.
When Duolingo redesigned its app in 2022, engagement spiked overnight. However, without qualitative feedback and behavioral insights, teams risk misreading signals, leading to frustration and churn. User feedback is valuable , but without data, its just opinions. Key differences between data types. The problem?
Product analytics can help by showing companies what is and isn’t working with their websites and apps, what to prioritize, and what to invest in. Startups in the program receive: $50,000 in credits toward the Mixpanel Growth Plan Credits worth 430 million monthly events Unlimited access to Cohorts, data modeling, and email support.
Last month we turned our attention to data – unleashing new features that help you improve how you collect, access, and use first-party data to influence your product and scale your business. Surveys: Now even more insightful and engaging. Gain deeper insights with advanced reporting for Surveys.
According to the Nielsen Norman Group, quantitative data can identify where users encounter problems, but it often fails to explain why those problems occur Nielsen Norman Group,2023. The Emergence of Research-Driven Growth Authentic growth lies not only in analyzing quantitative data but in deeply understanding user behavior and motivations.
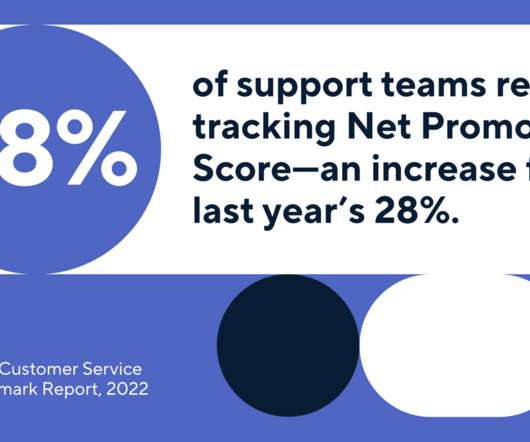
But there’s a silver lining – this year’s Klaus Customer Service Quality Benchmark Report reveals there are clear positive shifts taking place in the customer support landscape in 2022. Klaus partnered with Intercom, Aircall , and Support Driven to create the second edition of the highly anticipated benchmark report.
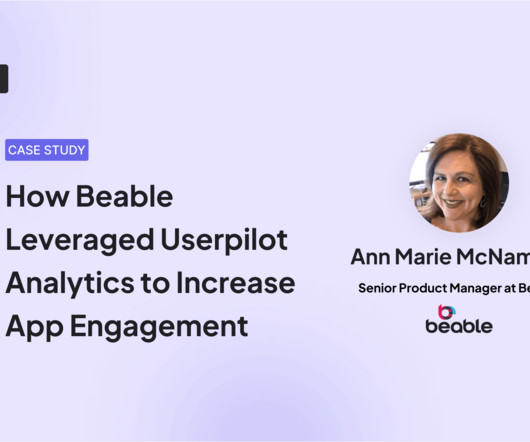
We chatted with Ann Marie McNamara, Beable’s Senior Product Manager, about how the company used Userpilot analytics and feedback features to enhance user experience and engagement. If you’re looking for a robust product growth platform with advanced feedback and analytics features, book the demo! Userpilot solved both problems.
Software-as-a-service (SaaS) models, which operate on a subscription basis and are centralized and situated on a remote cloud network, are increasingly popular with businesses for a variety of factors, including flexibility and affordability. Saas startups that provide software as a service have a good delivery model. What Is Saas? — Brief
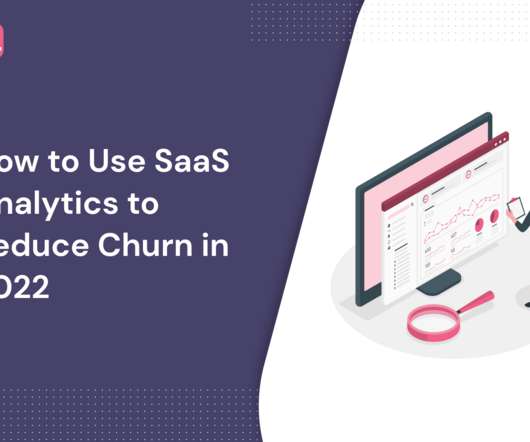
Are you wondering how to effectively use SaaS analytics to reduce churn? You can collect heaps of data but they won’t be of any use if you don’t know what to do with them. SaaS analytics allow you to leverage the data to gain actionable insights and make informed decisions. What is SaaS analytics?
Reveal Embedded Analytics. Chartio is a cloud-based business intelligence and analytics solution that provides business teams with the tools and functionalities for data exploration and datavisualization. You may have heard already, Chartio is going away on March 1, 2022. Or it used to be.
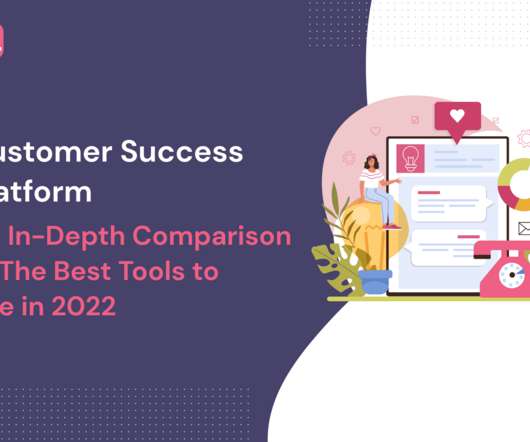
Is your customer success platform up to scratch for 2022? In this blog, we’ll look at what you should expect from a platform, and give you our honest opinions on what the best customer success tools available right now are. iii) analytics and (iv) segmentation capabilities, (v) security, and (vi) third-party integrations.
Analysts estimate that by 2022, global corporate eLearning will grow to be a $30 billion market. Last year Deloitte reported that the half-life of skills has fallen to five years, meaning the average person will need to retrain or reskill up to 10 times over the course of their working lives.
Cloud eCommerce refers to the remote network practice of servers to use applications, store, and process data via the Internet. 2022 has experienced dynamic demands and unpredictable events in the market. So eCommerce firms need to optimize their spending and gain insights into their operations. trillion in 2022.
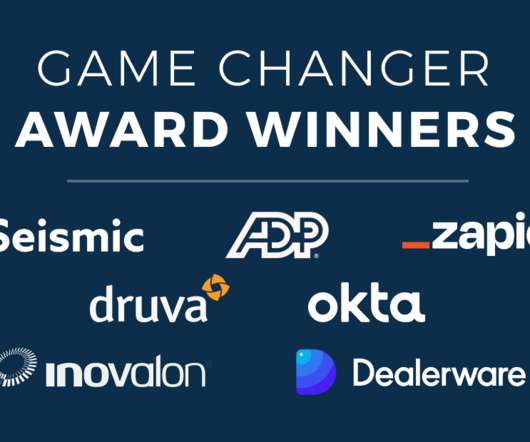
Congratulations to the winners of the 2022 GameChanger awards! Seismic won the Visionary award, given to an organization that has mastered using 360 views, scorecards, and advanced reporting to shift their teams from reactive to proactive. Druva offers an industry-leading data protection platform for the cloud era.
Reveal Embedded Analytics. A great embedded analytics solution can enhance data-driven decision-making and lead to improved outcomes with powerful, high-impact dashboards. Too often, unfortunately, valuable business data is obscured by a bad presentation. What is dashboard UI? What Is Dashboard UI?
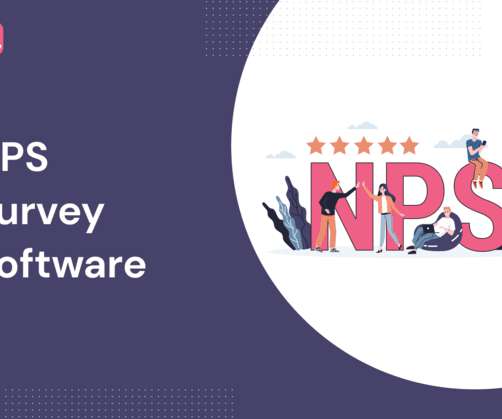
Every business has its own unique needs and goals when it comes to collecting user satisfaction data. That’s why we’re taking a look at the best NPS software so you can find the best match for your business and get on the road to sending those insightful surveys! This is your quantitative NPS metric.
Do you need to worry about data discrepancy? More importantly, we will show you: How to identify them What causes data discrepancies And how to leverage product analyticstools to avoid the issue Let’s dive in! To identify data discrepancies, first cross-reference different data sources and look for inconsistencies.
They are the perfect tool that ensures the businesses with real-time conversion of leads with personalized assistance that can increase businesses efficiency. Amongst all, one of the major highlights would be to have a check on hosting services. The key that boosts your sales, marketing and customer support. Hosted Source Code?—?
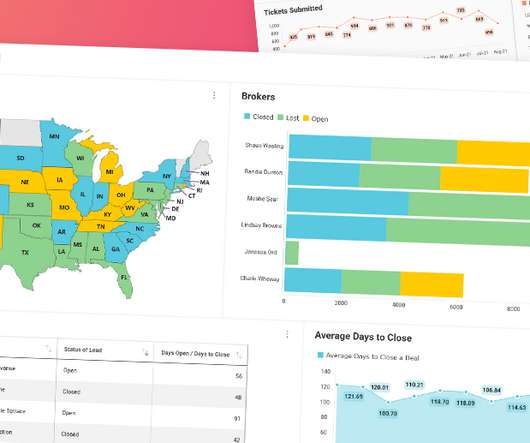
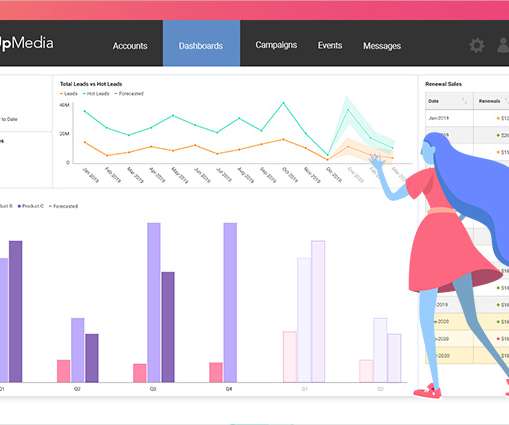
Sharing our product-analyticsdashboard for tracking business health. The economy was in the midst of a bounceback at the start of 2022. Making the necessary tradeoffs is really difficult and that’s where product analytics can become indispensable. An example of a early warning dashboard with sample data.
Serving as the primary tool for showcasing skills and experience, they have been the gateway to countless career opportunities. As Peter Drucker once said, The best way to predict the future is to create it, and dynamic profiles are helping professionals do just that by redefining careersuccess.
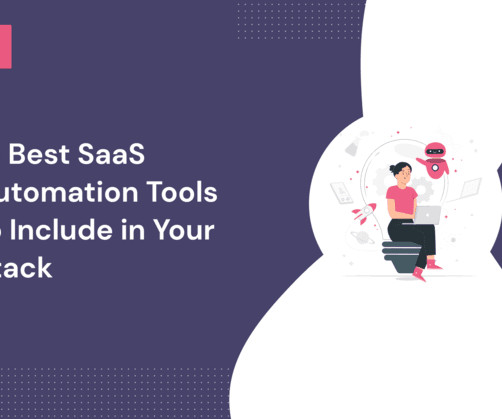
Are you wondering which SaaS automation tool to use for your business? In this guide, you’ll learn about the best automation tools you should be using in your SaaS. SaaS automation is a way of making manual processes automated with the use of a SaaS service. Hootsuite is an all-in-one social media automation tool.
Reveal Embedded Analytics. DataAnalytics Build for Embed – Simple. Predictible. Superior User Experience – Excite your users by making it easy for them to create, edit, and apply machine learning models to their own datavisualizations without leaving your application. SDK Improvements.
In fact, studies predict that in the foreseeable future, customer experience will become more important than price and even the product itself. Customers expect personalized experiences , so collect customer data, segment them and trigger relevant flows. Users don’t want to wait for ages for customer service agents to respond.
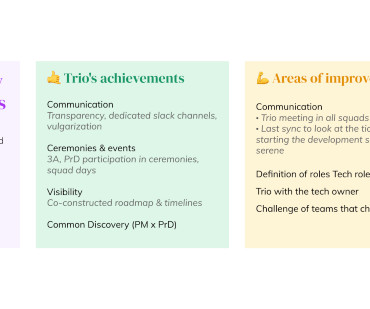
We’ll learn about how they started rolling out the product trio model at Botify, some of the tools and tactics they’ve developed to guide their work, and what they’ve observed from the research they’ve conducted with other product leaders and trios. Claire also wrote an article on Medium to share their progress and learnings in October 2022.
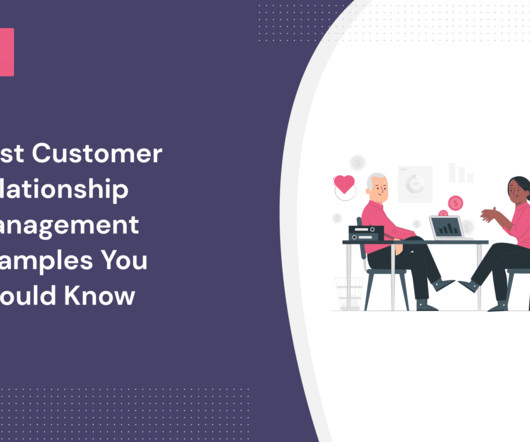
Toward the end of the article, we highlighted the types of CRM systems and different CRM tools that might be helpful to you. Data-driven decisions. Automated customer service relationships. Omnichannel service. Analytical CRM: This is more technical and mainly focuses on using customer data to improve customer experience.
In this article, we’ll discuss the current state of the fintech market, the occurring trends for 2022 and beyond, and the number of resources needed for a successful project. Banking mobile apps, trading platforms, blockchain, contactless payments, NFT, financial data analysis-all these terms fall into the fintech category.
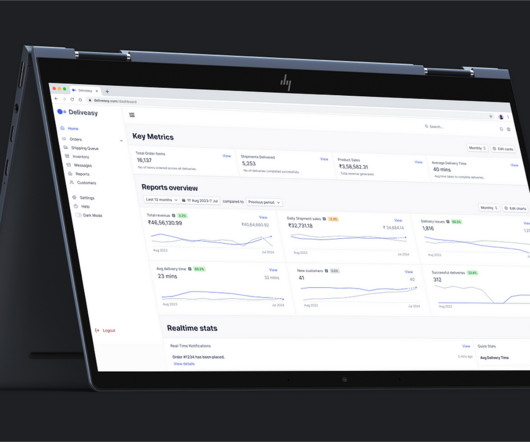
Deliveasy enhances delivery efficiency and customer satisfaction for Indian supermarkets with real-time tracking, route optimization, and detailed analytics. From 2019 to 2022, MENA and Indonesia saw over 100% CAGR, while India had a 66% CAGR. Revenue Growth: Attain an increase in revenue from Deliveasy subscriptions and services.
This guide covers everything you need to know about outsourced software product development services , from core definitions and benefits to a stepbystep process, pros and cons, realworld case studies, and future trends. This lean approach allowed the founding team to validate the market before investing in a full inhouse team.
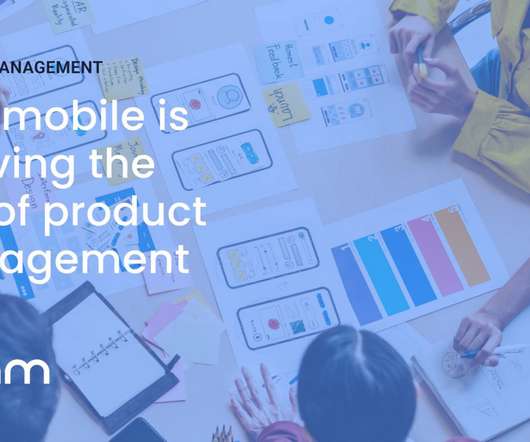
In the second quarter of 2022, mobile devices (excluding tablets) generated nearly of global website traffic. In 2023, more web-based businesses will be opting to develop mobile apps to build a loyal customer base, uncover more valuable user insights, and facilitate a more seamless user journey. Example of mobile app storyboarding.
Reveal Embedded Analytics. The business intelligence (BI) and dataanalytics world continue to undergo massive transformations every year. Spreadsheets finally yield their buried treasure and evolved into insightfuldatavisualizations and interactive high-impact dashboards. So, what is to come?
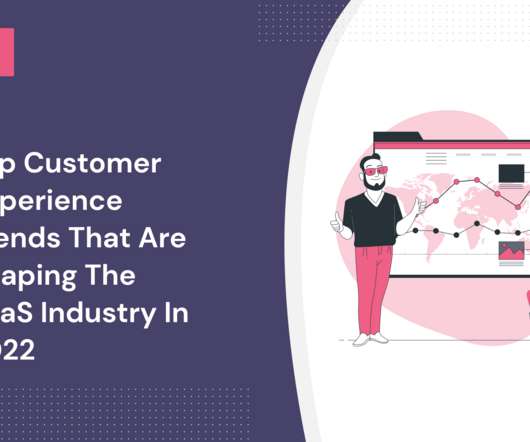
In 2022, when the SaaS market is crowded with tons of similar products, the best ones are those who delight their customers regularly. We have created an ultimate guide that will serve as a blueprint for SaaS owners to maximize SaaS customer success in 2022. Customer Success is a core growth driver for any SaaS business. No worries!
How can you use knowledge base tools to guide your customers and remove their frustrations while using your product? An in-app knowledge base enables you to take advantage of the self-serve support model for effective customer service delivery. There are numerous knowledge base tools in the market.
Photo by NordWood Themes on Unsplash Measuring user experience (UX) has always been a complex challenge, requiring a blend of creativity and data-driven precision. Lets look at FinTrack, a hypothetical financial management tool that helps users with budgeting, expense tracking, and financial goal setting.
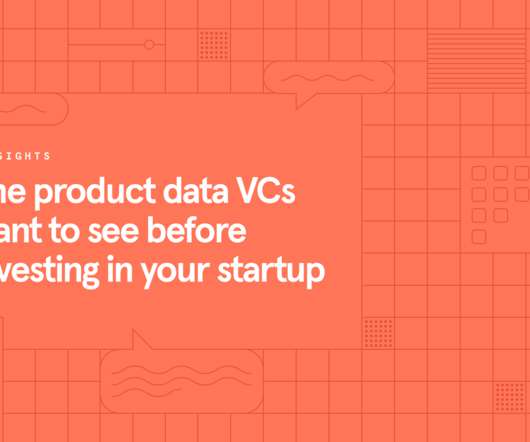
In October 2022, Crunchbase reported that funding rounds for private companies have dropped 53% year-over-year. If your startup is vying for an investment when there are fewer dollars to go around, it makes coming up with a compelling product idea and showcasing demand for it with data even more important.
Reveal Embedded Analytics. DataAnalytics Build for Embed – Simple. Predictable. . embedded analytics ?product,?we’ve?had Provide an easy-to-integrate dataanalytics solution that customers?can Our goal is to deliver an amazing end-user UX for self-service?BI, BI, deep dataanalytics, and?
After all, almost any product or service can be replicated by a competitor. Since then, in anticipation of Intercom’s R&D plan for 2022, we started looking at our internal cadence of productivity and kicked off a project to evaluate each process from ideation to shipping. This is our first episode of 2022. Paul, how are you?
The unshakable fact is that, according to many of the analyses of the market, there are almost 30 million crypto wallets, along with the sales volumes of NFTs reaching beyond $40 billion by this fiscal year, 2022. This feature can show all the desired data of the digital assets within the same portal far more comfortably.
There are enough stories of data breaches and cyber attacks to chill even the savviest security engineer to the core. Suddenly, the team got to know SOC 2 Reports all too well and realized just how burdensome and unscalable it could become, especially for high-growth startups. And that’s where people like Adam Markowitz come in.
Userpilot can help you collect user feedback and measure customer satisfaction with its customizable microsurveys, follow-up questions, and advanced analytics. Customer satisfaction refers to measuring how satisfied your customers are with your products, services, and business as a whole. What is customer satisfaction?
Product positioning is a process that aims at determining how the service or product is situated on the market and why it is superior to those of your competitors. As a product or service provider, your goal is to attract those customers who have a clear idea of what they need in a product, why they need it, and what can satisfy those needs.
Reveal Embedded Analytics. According to Reveal’s top software challenges for 2022report , citizen developers and low-code/no-code tools can help meet the demand for building applications faster and with fewer resources. Low-code/no-code development is a game-changer. What Is Low-Code/No-Code Development?
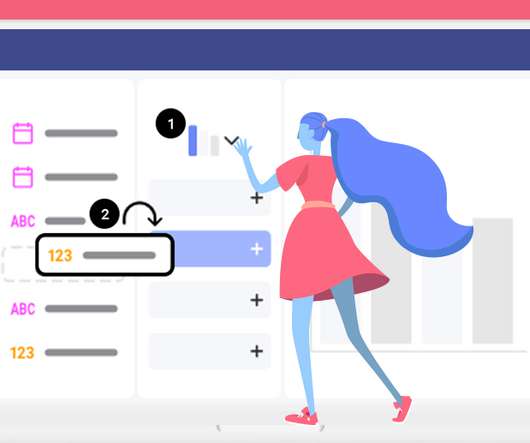
It’s smarter to build your tooltips code-free using a tool like Userpilot, rather than trying to code everything yourself from scratch. Postfity is a social media scheduling tool, so one of the main features it provides is the ability to post social media content. What is a tooltip? Start building tooltips with Userpilot.
We organize all of the trending information in your field so you don't have to. Join 96,000+ users and stay up to date on the latest articles your peers are reading.
You know about us, now we want to get to know you!
Let's personalize your content
Let's get even more personalized
We recognize your account from another site in our network, please click 'Send Email' below to continue with verifying your account and setting a password.


Let's personalize your content