This site uses cookies to improve your experience. To help us insure we adhere to various privacy regulations, please select your country/region of residence. If you do not select a country, we will assume you are from the United States. Select your Cookie Settings or view our Privacy Policy and Terms of Use.
Cookie Settings
Cookies and similar technologies are used on this website for proper function of the website, for tracking performance analytics and for marketing purposes. We and some of our third-party providers may use cookie data for various purposes. Please review the cookie settings below and choose your preference.
Used for the proper function of the website
Used for monitoring website traffic and interactions
Cookie Settings
Cookies and similar technologies are used on this website for proper function of the website, for tracking performance analytics and for marketing purposes. We and some of our third-party providers may use cookie data for various purposes. Please review the cookie settings below and choose your preference.
Strictly Necessary: Used for the proper function of the website
Performance/Analytics: Used for monitoring website traffic and interactions
The Value of Using a Jobs Dashboard to Drive Your Demo Most software sales demos follow the same formula a handful of slides telling buyers about your company followed by an overview of the product, and then you dive into the demo. The jobs dashboard is your way of serving the meal in easily digestible portions.
Reveal Embedded Analytics We know how difficult it is to create dashboards, especially for web applications. Thats what dashboards are for. In fact, Angular dashboards can provide key insights that will eventually allow data-driven decision-making at your company. What is an Angular Dashboard Library? Dont worry.
He is convinced that product is the single most important success driver for tech companies, which is why he founded Prodify to share what he learned from being an advisor to over 50 tech companies to realize their full potential. I founded Prodify so my team and I can help companies by sharing knowledge from our previous experiences.
When it comes to product management, you need to look at different SaaS dashboard examples to see what kind of product analytics you can measure, and how. So what are the most important types of dashboards and which ones are the best for you? A SaaS (software-as-a-service) dashboard is a centralized interface within your app.
But today, dashboards and visualizations have become table stakes. Think your customers will pay more for data visualizations in your application? Five years ago they may have. Discover which features will differentiate your application and maximize the ROI of your embedded analytics. Brought to you by Logi Analytics.
Custom dashboards to track key metrics at a glance. Pendo The dashboard on Pendo. Additional reports: You get a built-in Product Engagement Score dashboard. Lack of templates: There arent many ready-to-use dashboards or templates to get started quickly. UserGuiding dashboard. for collecting user sentiment data.
This information empowers teams across your company to make informed decisions based on customer experiences and perceptions. It helps reveal how effectively a company meets its customers’ needs and expectations. As a result, companies can drive actionable improvements based on the feedback they receive.
Are you wondering how the new Userpilot custom analytics dashboards can help you drive product growth? In this article, you will learn about the main benefits of custom product analytics dashboards and how to create them in Userpilot. TL;DR Userpilot custom analytics dashboards allow you to display multiple reports in one place.
Would you like to learn how to design a SaaS metrics dashboard for your team without any coding? In the article, you will find examples of various SaaS dashboards and learn how to create them with Userpilot analytics. In Userpilot, click Dashboards in the menu and click the ‘ Create New ’ button. Let's dive in, shall we?
Speaker: Andrew Wynn, Senior Product Manager, Looker
But proper data analytics solutions take work to deliver - it's not as simple as just building a dashboard. How to adapt solutions for different company sizes. As a product manager, you know how helpful custom tailored data solutions can be to doing your job well. In this webinar, we'll cover: Real examples for different verticals.
In our webinar, Chaos to Clarity , Kenny Kranseler and Tom Evans shared a fictional case study that hits close to home for many PMs: WellNest Health , a company with a strong reputation and a bloated backlog. One insight: HR managers didn’t just need dashboards. What WellNest needed wasn’t another roadmap or velocity boost.
Plus, the ability to create custom NPS dashboards allow you to analyze the results easily without writing a line of code. Get real-time access to customer feedback via a centralized dashboard that updates as responses come in. Customize the branding of your surveys to match your company’s design.
Wondering how to build a customer success dashboard for your team? From the article, you will learn what a customer success dashboard is, why you need it, and what metrics it should include. And how to build a dashboard for your customer success team using Userpilot analytics ! Populate your dashboard with up to 30 reports.
Best customer success software for startups and small companies. Top customer success management platforms for mid-market and enterprise companies. Reporting and dashboards for outcome tracking. Reporting and dashboards for keeping a real-time pulse on customer sentiment. Defining a customer success tool and other FAQs.
Which is why leading SaaS companies leverage embedded analytics as. The post Introducing Qrvey 9: MultiCloud Embedded Analytics and Unified Dashboards appeared first on Qrvey. There is a huge opportunity to add value with your analytics experience it improves customer happiness, and drives engagement and stickiness.
When Jane, a seasoned product manager, started her new role at a fast-growing SaaS company, she was ready to make an impact. A dashboard showing metrics like feature adoption or user engagement amplifies your credibility. How to Inspire with Vision: Collaborate with stakeholders to co-create a vision that aligns with company goals.
Onboard and train users The average activation rate for medtech companies is 23.8%. For example, you could: Equip ICU teams with step-by-step walkthroughs so nurses can confidently use life-support dashboards in under ten minutes. That’s low when compared with the overall average of 37.5%. The main culprits? The average is 35.7,
This quick and efficient approach to product innovation is changing the game for companies big and small. Example: Imagine you’re designing a new dashboard for a fintech app. Example: For our dashboard, we might ask, “How might we create a dashboard that helps analysts quickly spot trends and take action?”
The best retail companies use feedback to inform product decisions, align teams around the Voice of the Customer, and fix whats not quite working. Turn survey responses, review data, and post-purchase feedback into clear dashboards your teams can actually use. But this system only works if you take action on the feedback collected.
Kevin has almost a decade of experience working at some of the world’s most innovative software companies. There are three main culprits as to why: Inefficiency : Companies might use many product analytics tools to track monthly active users. But soon enough, there comes a point where it’s just one dashboard too many.
Start by identifying the top problems that your company faces, especially ones where you already have some data. So for most companies, purchasing an analytics tool is a better option than building one from scratch. Maturity refers to how well your company collects, processes, and utilizes data in its decision-making process.
When your company adopts multiple SaaS solutions to drive productivity, you unknowingly create a perfect storm for data fragmentation. Based on your current dashboard, it looks like most users churn before completing onboarding. Sound familiar? Which features need attention? Say youre working on a feature release.
Problem Brief Over a span of 4 weeks, we tested Civians platform and created design solutions to improve the overall user experience of the dashboard. We also encouraged them to think out loud while they were navigating the dashboard, to help us uncover their mental model and identify hidden insights.
Customer Relationship Management tools that help manage a company’s interactions with current and potential customers. Analytics tools Analytics tools help companies track, analyze, and determine the efficiency of their marketing processes, ultimately helping them optimize efforts and improve decision-making.
While the idea is nice, implementation is much trickier, and many companies revert to simple feature stacking instead. However, truly implementing that concept is not so trivial, and many companies simply give it up and stick to their old habits of planning by stacking features against a timeline.
This metric helps SaaS companies track the effectiveness of their expansion efforts. By increasing the value provided to existing customers through different expansion tactics, companies can reduce churn and enhance customer lifetime value. SaaS companies do it by limiting access to their killer features in the lower plans.
Dashboard : Customize the analytics dashboard or choose from pre-built ones to easily visualize and compare key metrics over time. Company & user profiles : Better visualize company/user data for relevant insights into the users engaging with your product. UX analytics FAQs What is analytics in UX?
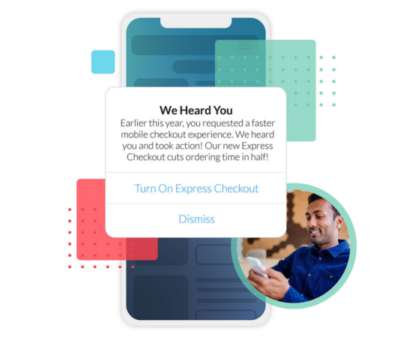
Yet, research indicates 67 percent of respondents who leave feedback in a mobile app never receive a response from the company. . ” Indeed, many companies struggle to follow-up on specific customer feedback because of resource or technology constraints. Modernized, WCAG-Compliant Interactions. Apptentive SDK 6.0
Data-driven companies are 58% more likely to hit revenue goals. It helps companies make smart decisions and optimize operations. Monitor with a churn prevention dashboard to improve retention. It involves gathering and examining data to find trends and patterns that can improve a company’s performance.
I had only been at this company for six months and I knew that ticket management was a huge build. It turns out it was over 35 forms that were riddled with conditional logic, a redundant backend ticketing system, several dashboard views and needed to cater to a myriad of job functions. About Jessica Waite.
This is quite normal – as a company or a team grows, it often takes time for an observability culture and solid alerting practices to take shape. Like all companies, Intercom is not immune to these inefficiencies. If it is actionable, is there a dashboard link and does it show all known potential causes?
Create custom reports and dashboards. It’s designed for medium-sized and large B2B companies that want to boost their growth rates by improving product adoption and customer retention. Recently, Userpilot launched custom dashboards so you can track all relevant metrics from one place without switching between tools and reports.
Different companies use different tools, and even teams within those companies rely on varied solutions. When one tool gathers feedback via email and another through your website, consolidating all that data and customer feedback can be nearly impossible. This ensures a consistent experience that builds trust and increases engagement.
But given the fact that this industry demands different touchpoints for its clients, it is only appropriate for insurance companies to make their services more accessible and in turn, keep track of their customers via mobile apps. So it’s imperative that insurance companies too should go for a mobile presence. trillion USD by 2025.
Customer Retention Rate (CRR) is a key business performance metric that measures the percentage of customers a company retains over a givenperiod. SaaS companies typically rely on subscription models so CRR is expected to behigh. SaaS companies typically use monthly or annual retention. SaaS: 85%95%. Telecom: 75%85%.
She coaches teams using my Continuous Discovery Habits curriculum and is helping me bring the Continuous Discovery Habits workshop to more companies. Product teams struggle to drive business outcomes because many companies haven’t taken the time to define their strategy. Help me in welcoming Hope as an official author. – Teresa.
And it’s great that more open-minded companies understand how important it is to think about all social groups when it comes to using the software. Statistics show that retail companies alone neglecting accessibility (blindness) lose almost $7 billion annually compared to their more caring competitors. The revenue aspect also matters.
Types of customer advocacy programs Companies use a few kinds of customer loyalty programs to boost visibility and drive growth : Customer referral programs reward users with discounts, upgrades, extra credits, or even monetary compensation for referring prospective customers to the product. Features & Events Dashboard in Userpilot.
Industry Stat: 57% of companies report significant improvements in product performance after adopting product analytics. Real-World Example If product analytics shows a high abandonment rate during a workflow, you might embed a dashboard or visualization that makes the workflow clearer. Why Is Product Analytics Important?
For example, say a user opens your app, skips the onboarding tutorial , and heads straight to the dashboard. For example: Suppose users are dropping off before finishing their dashboard setup. Mobile analytics : Track metrics like active users, activation rate, drop-offs, and top screens with customizable dashboards.
According to Harvard Business Review, 80% of new products fail, primarily because companies fail to conduct proper customer research. For SaaS companies, this “listening” can take many forms to learn how users interact with their product and uncover areas for improvement. Survey results dashboard in SurveyMonkey.
If you’ve been at your company for a while, you might get inspired after reading a book or attending a conference. If you’re joining a new company, you might want to try a new tactic out with your new team. Tali first became aware of opportunity solution trees and continuous discovery in a book club at her previous company.
The results reveal that companies integrating UX Research into their growth strategies see significant improvements in conversions, engagement, and retention, with well-documented returns on investment. Additional statistics reinforce this argument: 74% of SaaS companies consider their product the primary driver of growth OpenView, 2022.
The rapid shift to digital-first lifestyles has disrupted traditional financial services, forcing companies to rethink their approach to branding. The user journey-from the first login screen to the advanced investment dashboard-must reflect the institutions identity. A recognizable logo or clever tagline is no longer enough.
We organize all of the trending information in your field so you don't have to. Join 96,000+ users and stay up to date on the latest articles your peers are reading.
You know about us, now we want to get to know you!
Let's personalize your content
Let's get even more personalized
We recognize your account from another site in our network, please click 'Send Email' below to continue with verifying your account and setting a password.


Let's personalize your content