This site uses cookies to improve your experience. To help us insure we adhere to various privacy regulations, please select your country/region of residence. If you do not select a country, we will assume you are from the United States. Select your Cookie Settings or view our Privacy Policy and Terms of Use.
Cookie Settings
Cookies and similar technologies are used on this website for proper function of the website, for tracking performance analytics and for marketing purposes. We and some of our third-party providers may use cookie data for various purposes. Please review the cookie settings below and choose your preference.
Used for the proper function of the website
Used for monitoring website traffic and interactions
Cookie Settings
Cookies and similar technologies are used on this website for proper function of the website, for tracking performance analytics and for marketing purposes. We and some of our third-party providers may use cookie data for various purposes. Please review the cookie settings below and choose your preference.
Strictly Necessary: Used for the proper function of the website
Performance/Analytics: Used for monitoring website traffic and interactions
Introduction to customer satisfaction surveys Customer satisfaction surveys are vital tools for understanding what customers think, feel, and experience. Surveys provide a range of insights, from quick feedback after a purchase to in-depth assessments of brand loyalty. Don’t worry, we’ve got you.
Most product teams get mobile app analytics wrong. They track 47 different key performance indicators (KPIs) in their mobile analytics platform , spend hours debating dashboard numbers, yet can’t predict which users will churn next week The problem here isn’t a lack of data.
You reach out to all department heads and request to get data for your analysis: Marketing team for data on campaign conversion, customer support for data on call volumes, account team for data on customers feedback, product data for usage, etc. What is a product operations dashboard?
As you’re researching dashboardreportingtools, you’ve probably noticed how hard it is to find reliable information on the available solutions. TL;DR Dashboards display critical business data in real-time, streamlining decision-making and focusing on key metrics. Let’s dive in!
Think your customers will pay more for datavisualizations in your application? But today, dashboards and visualizations have become commonplace. Turning embedded analytics into a source of revenue means integrating advanced features in unique, hard-to-steal ways. Proven approaches to achieving analytics maturity.
When you’re building a mobile product , data is your lifeline. Whether for tracking feature adoption or spotting drop-off points, the right analyticstool can make or break your growth. Some tools are great for marketers, and others are for product or development teams.
Pro Tip: Pair your quick wins with data. A dashboard showing metrics like feature adoption or user engagement amplifies your credibility. Advanced Tactics: Stakeholder Mapping: Use tools like the Stakeholder Alignment Blueprint (available on jonihoadley.com) to identify key goals and concerns. Click here to download.
Heres how to take insights from customer feedback and turn them into results. You can download the free e-guide, here ! Build a foundation that drives action Use reportingtools to translate feedback into trends. Dont wait for quarterly NPS reports. Every retailer gets product complaints and feature requests.
It’s what you do with the behavior data your app collects. And by behavior data, I dont mean installs (thats the easy part). I mean what happens after the download: how users navigate, what features they engage with, and where they drop off. What separates a good app from a great one? What is mobile app tracking?
Dashboard design can mean the difference between users excitedly embracing your product or ignoring it altogether. Great dashboards lead to richer user experiences and significant return on investment (ROI), while poorly designed dashboards distract users, suppress adoption, and can even tarnish your project or brand.
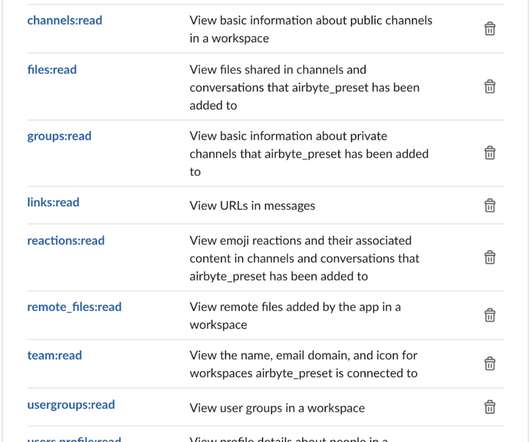
an open-source data integration platform?—?and an open-source data exploration platform?—?in We will use the Airbyte’s Slack connector to get the data off a Slack workspace (we will be using Airbyte’s own Slack workspace for this tutorial). We will save the data onto a PostgreSQL database. and Apache Superset ?—?an
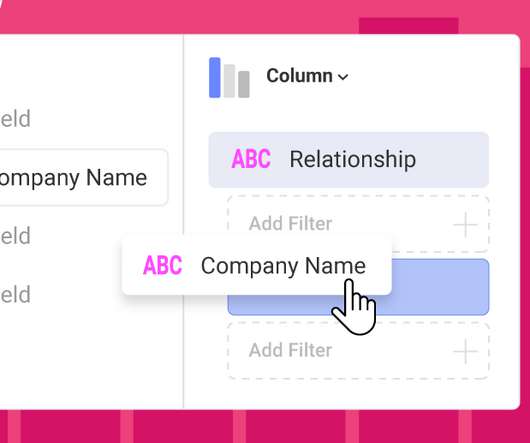
Reveal Embedded Analytics Embedded analytics platforms have gained popularity as businesses seek to leverage data for decision-making and gain a competitive edge. One of these features you should look for is dashboard linking. What Is Dashboard Linking? However, not all solutions are the same.
Reveal Embedded Analytics Embedded analytics platforms have gained popularity as businesses seek to leverage data for decision-making and gain a competitive edge. One of these features you should look for is dashboard linking. What Is Dashboard Linking? However, not all solutions are the same.
Reveal Embedded Analytics If you’ve ever struggled to create new dashboards with similar KPIs, integrations, and layouts but different data sources, this article is for you. What Are Dashboard Templates? Why Care About Dashboard Templates?
Think your customers will pay more for datavisualizations in your application? But today, dashboards and visualizations have become table stakes. Turning analytics into a source of revenue means integrating advanced features in unique, hard-to-steal ways. Five years ago, they may have.
Quantitative data alone doesn’t reveal intent, only outcomes. By combining contextual insights from session replays , heatmaps, and behavior analytics, user session analysis helps you interpret metrics through the lens of real user journeys. Tools can track every click and interaction.
Reveal Embedded Analytics We live in an era where data shapes decisions across industries. While datavisualizations have become essential, not all standard visualizations cater to specialized reporting needs. Dive in to discover its unmatched benefits and how you can craft unique reports effortlessly.
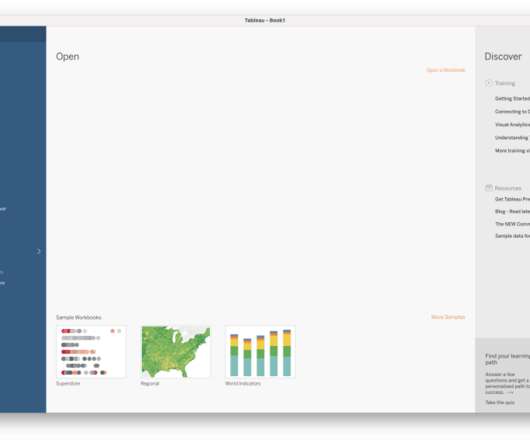
We will be using Airbyte (an open-source data integration platform) and Tableau (a business intelligence and analytics software) for this tutorial. Step 1: Replicating Zoom data to PostgreSQL Launching Airbyte In order to replicate Zoom data, we will need to use Airbyte’s Zoom connector. Leave all the fields checked.
Reveal Embedded Analytics. Integrating an embedded analytics solution into your software comes with tremendous opportunities to expand your business and drive new revenue streams. Why Is DataAnalytics in SaaS Platforms Important? 4 Ways to Monetize Your DataAnalytics Offering. Low-code/no-code tools.
Every data-driven project calls for a review of your data architecture—and that includes embedded analytics. Before you add new dashboards and reports to your application, you need to evaluate your data architecture with analytics in mind.
Heap and Google Analytics are popular product analyticstools that help businesses pursue product growth with data-driven insights. In this article, we’ll go through the main differences between both tools to help you understand which one is better for you. respectively. What is Heap?
Gaming data is one of the most valuable sources of information out there. . gamers’ weekly leisure time going to playing games as of 2018 — companies are sitting on treasure troves of insight. You need an analytics solution and data strategy that can help make that information useful. . What Is Gaming Analytics?
As they wait for the downloads to come, they realize—all too late—the fallacy of this assumption. Landing pages can be set up with no cost or hassle with a tool like Squarespace or Wix. If you’re to integrate analytics, Squarespace is readily equipped for A/B testing and Wix has a number of plug-ins that will do the trick.
Last month we turned our attention to data – unleashing new features that help you improve how you collect, access, and use first-party data to influence your product and scale your business. Surveys: Now even more insightful and engaging. Gain deeper insights with advanced reporting for Surveys.
Embedding dashboards, reports and analytics in your application presents unique opportunities and poses unique challenges. We interviewed 16 experts across business intelligence, UI/UX, security and more to find out what it takes to build an application with analytics at its core.
Multiple industries are suddenly forced to move operations online, and support teams are at the forefront of this transformation – battling every day to deliver excellent, fast customer service, while facing an unprecedented volume of enquiries and issues. Sophisticated reporting for valuable insights.
Looking for a Google Analytics alternative that offers better customization, improved product analytics , and more data accuracy? TL;DR Google Analytics is an analytics platform offered by Google that helps businesses track website or app performance. Limited data control and ownership.
More tools. But throwing more tools or roles at it just creates noise if you dont solve the root problem. More PMs, more tools, more roadmapsand less alignment. PMs dont win races by driving harderthey win when someones removing friction, refueling the engine, and handing them the data they need to stay ahead. More teams.
Reveal Embedded Analytics The critical role of customer satisfaction in today’s hyper-competitive, data-centric world is unequivocal. This is where embedded analytics’ power shines as a pivotal tool in enhancing customer satisfaction and driving business momentum. The result?
When your customers come to your app, what do they see: clunky, outdated dashboards or a sleek, modern interface? If your embedded analytics are looking stale, leverage these free graphics libraries to take your embedded analytics offerings above and beyond.
With Userpilots mobile solution , you can personalize in-app flows, trigger context-aware push notifications, and capture real-time insights: all without writing a single line of code. To show you how, Ill cover seven strategies that smooth out friction, enhance user engagement, and turn one-off app downloads into returning customers.
Reveal Embedded Analytics. Traditional business intelligence and analytics solutions are made for data analysts and technical users. But in today’s fast-paced business environment, all users, regardless of skills and department need quick and easy access to data and the ability to work with it on their own.
Overview: Mobile app analytics metrics Below is a quick summary of the mobile metrics every PM should be tracking. 6 Acquisition App downloads Track initial user acquisition and measure marketing campaign effectiveness. 6 Acquisition App downloads Track initial user acquisition and measure marketing campaign effectiveness.
When it comes to boosting your product growth, user tracking tools can make your life a lot easier. They offer insights into product performance , what your users are doing inside your product, and why they are doing it. But how do you know you’re picking the right tools? Tableau is the best user datavisualizationtool.
Which sophisticated analytics capabilities can give your application a competitive edge? In its 2020 Embedded BI Market Study, Dresner Advisory Services continues to identify the importance of embedded analytics in technologies and initiatives strategic to business intelligence.
Generating data is easy. Data is often not accessible unless you can write code. People in non-technical roles rely on data every day to make decisions, develop ideas or measure success. When tools and systems are not created with them in mind, they lose trust and understanding. It doesn’t have to be this way.
Thanks to the abundance of tools out there, marketing has never been easier. In this article, we examine some tools that can help your SaaS team to drive product growth. We will also consider valuable examples of tools that can inspire your process. The best examples are Userpilot , Hotjar , and Google Analytics.
It makes your app easier to find and increases the likelihood of it being downloaded. In fact, 72% of consumers say they only engage with personalized messaging, such as recommendations, messages, and visuals tailored to their behavior. Review your app analytics to identify underused features. Nike is the best example here.
Download your copy of the thought leadership paper now. Not only that, but 49% say those interactions are highly complex, and 32% report that there have been more emotional customer support interactions. Challenge #2: Agents are wasting time jumping between tools. Sound familiar?
Think your customers will pay more for datavisualizations in your application? But today, dashboards and visualizations have become table stakes. Discover which features will differentiate your application and maximize the ROI of your embedded analytics. Brought to you by Logi Analytics.
One look at your mobile app analyticsdashboard, and you just want to shut your eyes and scream in frustration. You aim to extract meaningful insights to improve app performance and user engagement. What decision will this data influence? Data is not fulfilling its value if it is not making an impact on your product.
Finally, you might be wrong and be missing out on potentially important insights because of an unwillingness to understand the person’s reasons. I think a datavisualizationdashboard would be great as a first screen in the back-office.”. Because otherwise users have to go to the reports screen, and they shouldn’t.
According to a 2024 analysis , on average, over 95% of users who download a new mobile Android app abandon it within the first 30 days. Put simply, app downloads are great but insufficient. How do app users interact with it from the moment they download it and beyond? Userpilot ‘s mobile app performance dashboard.
Reveal Embedded Analytics. Embedded analytics is everywhere around us – in our cars, in our homes, in our security systems, in the digital advertising that we see while surfing the web, and even in the healthcare services we are being treated with. And that is because data nowadays is everything. Especially in business.
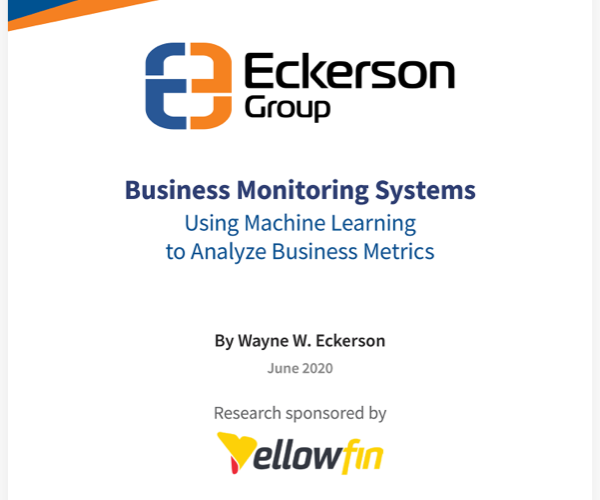
This whitepaper discusses how automated business monitoring solutions like Yellowfin Signals revolutionize the way users discover critical and relevant insights from their data. Download to learn: 5 business benefits of automated data discovery with ABM. The evolution of dashboards to automated business monitoring.
We organize all of the trending information in your field so you don't have to. Join 96,000+ users and stay up to date on the latest articles your peers are reading.
You know about us, now we want to get to know you!
Let's personalize your content
Let's get even more personalized
We recognize your account from another site in our network, please click 'Send Email' below to continue with verifying your account and setting a password.


Let's personalize your content