This site uses cookies to improve your experience. To help us insure we adhere to various privacy regulations, please select your country/region of residence. If you do not select a country, we will assume you are from the United States. Select your Cookie Settings or view our Privacy Policy and Terms of Use.
Cookie Settings
Cookies and similar technologies are used on this website for proper function of the website, for tracking performance analytics and for marketing purposes. We and some of our third-party providers may use cookie data for various purposes. Please review the cookie settings below and choose your preference.
Used for the proper function of the website
Used for monitoring website traffic and interactions
Cookie Settings
Cookies and similar technologies are used on this website for proper function of the website, for tracking performance analytics and for marketing purposes. We and some of our third-party providers may use cookie data for various purposes. Please review the cookie settings below and choose your preference.
Strictly Necessary: Used for the proper function of the website
Performance/Analytics: Used for monitoring website traffic and interactions
So, how do you get started with product analytics ? How to apply actionable metrics to different SaaS business stages. Product analytics refers to the process of gathering and analyzing data on how users interact with a product. How to build a product analytics strategy? What is product analytics?
Example: Imagine you’re designing a new dashboard for a fintech app. This is where you’ll use the classic “How might we…” question to frame the problem. Example: For our dashboard, we might ask, “How might we create a dashboard that helps analysts quickly spot trends and take action?”
Based on your current dashboard, it looks like most users churn before completing onboarding. How to solve data fragmentation Solving data fragmentation isnt just about buying another integration tool. Bad data leads to bad decisions, whether that means duplicated records, misfired onboarding flows, or false signals in your dashboards.
In this article, you will explore why customer expansion matters for your SaaS growth, discover various customer expansion tactics, and learn how to embed them in successful expansion campaigns. How to calculate customer expansion revenue? Well, you can easily track the metrics from one of Userpilot’s analytics dashboards.
Speaker: Miles Robinson, Agile and Management Consultant, Motivational Speaker
Join Miles Robinson, Agile and Management Consultant, as he covers five key considerations for you to keep in mind when you’re updating your software or app to offer the latest in embedded dashboards. You’ll leave with a better understanding of where to begin on creating actionable, insightful dashboards.
How to start acting on product analytics the right way? He makes product decisions every day: what stock to order, how to arrange his shelves, and even which Squishee flavors to promote. How to get started with actionable analytics So, if you’ve been doing product analytics wrong, what’s the “correct” way?
Mobile app tracking captures data on how users interact with your app, including actions such as screen views, button taps, session length, and feature usage. For example, say a user opens your app, skips the onboarding tutorial , and heads straight to the dashboard. How to track it? What to use it for? What does that tell you?
Would you like to learn how to design a SaaS metrics dashboard for your team without any coding? In the article, you will find examples of various SaaS dashboards and learn how to create them with Userpilot analytics. We also explain what metrics you may want to track and how to use the insights they offer.
Wondering how to build a customer success dashboard for your team? From the article, you will learn what a customer success dashboard is, why you need it, and what metrics it should include. And how to build a dashboard for your customer success team using Userpilot analytics ! If so, we’ve got you covered!
Speaker: Laura Klein, Principal at Users Know and Author of UX for Lean Startups
That's why Laura Klein, product manager and UX designer, has a set of tips to help application teams improve their embedded dashboards and reports. You'll learn: How to develop products that boost your business's bottom line while dramatically improving customer experience. How to avoid common mistakes people make when presenting data.
Build your first analytics dashboard by following our step-by-step guide that explains what makes an effective analytics dashboard and how to implement it.
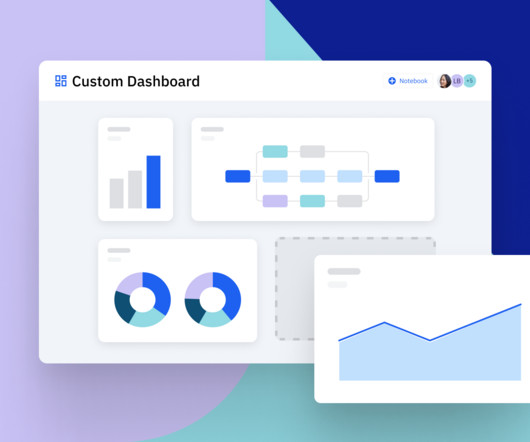
Are you wondering how the new Userpilot custom analytics dashboards can help you drive product growth? In this article, you will learn about the main benefits of custom product analytics dashboards and how to create them in Userpilot. Why use Userpilot custom analytics dashboards? Let’s get to it!
A small number of indicators are helpful for safely getting to your destination, including how fast you are travelling and how much battery/fuel is left. The post How to Choose the Right KPIs for Your Product appeared first on Roman Pichler. Think of driving a car.
How to write a release note Great release notes are written in simple language and are easily understood by team members and users. Highlight any improvements that enhance existing functionality Clearly explain how the improvement will enhance the user's experience and quantify the improvement if possible. Notion release notes.
Early stage startups in particular may not need a four year business plan, but they need to start building out a model which will show how they can someday be profitable. You'll learn: How to turn basic dashboard metrics into a financial model. Learn how margin of error impacts financial projections.
How to Get Started: Audit the Product Backlog: Pinpoint low-effort, high-value opportunities to drive quick results. Communicate Progress Early: Regular updates on winsno matter how smallbuild trust and momentum. A dashboard showing metrics like feature adoption or user engagement amplifies your credibility.
In this article, Ill tell you how to: Increase user acquisition with ASO and referral programs. How to attract new users to your app Most product teams obsess over activation. Here’s how to build that system: 1. How to increase app retention among existing users Getting users through the door is only half the battle.
How to design mobile apps forlearning Educational app design involves a structured approach where you calculate eachstep. Make your appclear: Provide instructions on how to use yourapp. Language Dashboard Mobile App by Conceptzilla Learning app designtrends Apart from psychology and gamification, you can leverage the latest trends.
One insight: HR managers didn’t just need dashboards. They tested ideas early (before building) With insight in hand, the team brainstormed widely and used “How might we” questions to frame opportunity areas. They needed clear, customizable ways to show WellNest program ROI to their leadership. That shaped everything that came next.
Embedding dashboards, reports and analytics in your application presents unique opportunities and poses unique challenges. We interviewed 16 experts across business intelligence, UI/UX, security and more to find out what it takes to build an application with analytics at its core.
For example, when metrics show teams actively using dashboards but having low report exports, replays reveal them taking screenshots instead. Track user engagement trends in Userpilot with interactive dashboards showing daily and weekly behavior patterns. They’re not struggling with export functionality.
It’s also important to be able to quickly and efficiently track how your team is performing against key metrics , so you know whether you’re on par with industry standards and delivering the high-quality experience your customers expect. Look for something with customizable, visual dashboards that allow you to create custom reports.
Heres how to take insights from customer feedback and turn them into results. Turn survey responses, review data, and post-purchase feedback into clear dashboards your teams can actually use. Reinforce this with regular CX syncs, shout-outs for teams who act on feedback, and training on how to spot and solve customer pain points.
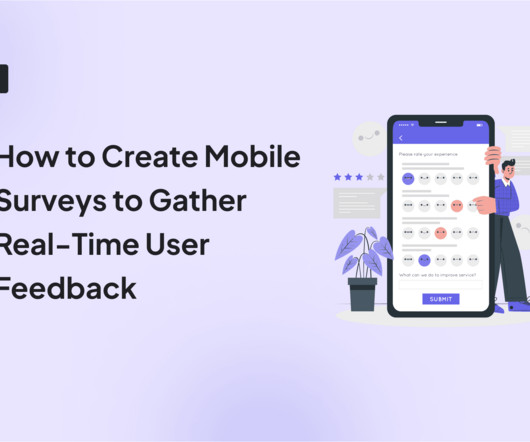
Step 1: Log in to your Userpilot dashboard and choose a survey template from the library. Here’s a step-by-step guide to creating your own mobile in-app surveys using Userpilot, a platform that helps you quickly build and deploy surveys to mobile phones and tablets.
Before you add new dashboards and reports to your application, you need to evaluate your data architecture with analytics in mind. Discover the pros and cons of each approach, plus how to choose the right architecture for your business priorities, timeline, and customers.
Step 1: Identify the metric or feature that requires customer feedback The metric or feature selection depends on what stage the product is at and what problems are being addressed such as how to acquire new customers, how to increase trial conversion rate, how to increase adoption of a new feature, what is the feedback on a particular feature?—?specifically
How to choose the right customer success platform Selecting the right customer success software requires careful consideration to ensure it effectively addresses your team’s specific challenges and integrates well with your company’s overall tech stack. Reporting and dashboards for outcome tracking. Reporting and dashboards.
They show regular users how theyve progressed over time, whereas users with playlists receive push notifications to play their mix and run. In just a few clicks, you combine properties and events to craft ultra-specific segments and deploy targeted campaigns directly from the Userpilot dashboard. Source: Intercom. Source: nGrow.ai.
Please see my article “ Leading Through Shared Goals ” and my book How to Lead in Product Management for more information how to effectively use the goals in figure 1, which includes securing the necessary buy-in from the stakeholders and development teams. It took me years to come up with the set of goals in figure 1.
Dashboard design can mean the difference between users excitedly embracing your product or ignoring it altogether. Great dashboards lead to richer user experiences and significant return on investment (ROI), while poorly designed dashboards distract users, suppress adoption, and can even tarnish your project or brand.
Userpilots analytics dashboard helps you measure your app’s overall usability, including: Views: The total number of times users encounter a specific flow or message. Review A/B test results in Userpilot. Completions: The count and percentage of users who finish the flow from the first to the last step.
Problem Brief Over a span of 4 weeks, we tested Civians platform and created design solutions to improve the overall user experience of the dashboard. We also encouraged them to think out loud while they were navigating the dashboard, to help us uncover their mental model and identify hidden insights.
How to start your UX analysis. UX analytics involves gathering, analyzing, and interpreting data about how users interact with your product or service. Dashboard : Customize the analytics dashboard or choose from pre-built ones to easily visualize and compare key metrics over time. UX analytics tools worth considering.
Challenges when tracking and analyzing user metrics (+ how to overcome them) Here are common challenges and actionable strategies to overcome them so your metrics drive meaningful results. Use Userpilot s analytics dashboard to see your user metrics in one place. Customer churn rate formula.
Speaker: Daniel O'Sullivan, Product Designer, nCino and Jeff Hudock, Senior Product Manager, nCino
In a world of information overload, it's more important than ever to have a dashboard that provides data that's not only interesting but actually relevant and timely. Dashboards assist decision makers facilitate new ideas and business opportunities, increase customer approval rates, and analyze current business process.
Whether you’re launching a new CX program or ready to take it to the next level, it’s crucial to understand the different types of customer satisfaction surveys and how to use them effectively. Real-time analysis helps respond to trends as they arise, with dashboards visualizing results for quick, data-driven decisions.
It’s no secret that learning how to evaluate product performance is essential for product management. But how can you effectively measure product metrics that can help you reach your goals and increase revenue growth? How to measure product performance? Here’s how you can measure product performance effectively: 1.
Communicate findings effectively A well-structured custom dashboard makes it easier for you to share insights across teams. When we launch a new feature, we create a funnel dashboard to measure how many users discover, activate, and keep using it. If engagement drops at any stage, we review session replays to understand why.
In our recent Productside Stories webinar, Ryan Cantwell (Principal Consultant & Trainer) at Productside) joined our COO Cynthia Petti to break down what product operations (ProdOps) actually is, how to spot when you need it, and (just as importantly) how to avoid turning it into another layer of process that slows everyone down.
Speaker: Jim O'Leary, VP of Product Management, and Brian Elmi, Director of Product Management, NTENT
Most product dashboard review lagging indicators rather than leading indicator and focus on the wrong metrics to move the business forward. Join Jim O'Leary and Brian Elmi of NTENT as they share exactly what they've done to build successful dashboards. How to democratize data so that all teams in an organization can benefit from it.
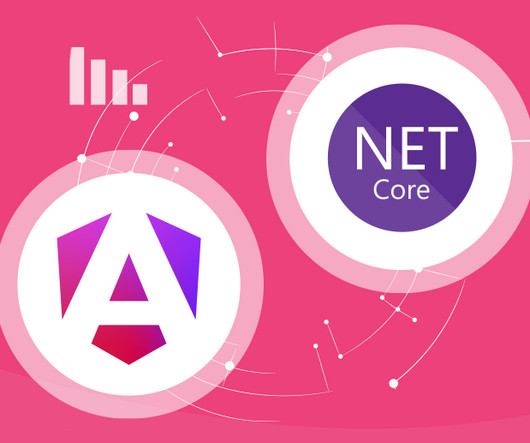
Lazy Loading: Load dashboards and components only when needed to improve app speed. Book a call on the Reveal website to see how we can solve your embedded analytics needs. Originally from How to Integrate Embedded Analytics in Angular Apps with.NET Core and written by Casey McGuigan.
or How can we make updates easier to access? This insight could lead to implementing shared dashboards or concise weekly recaps, fostering clearer communication and smoother collaboration. How to Start Asking Better Questions Asking better questions is a skill anyone can develop.
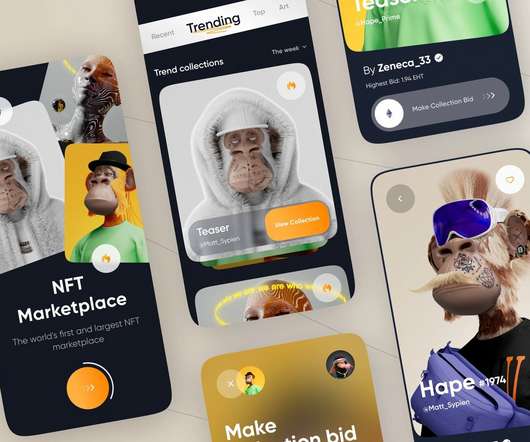
NFT dashboard/Storefront The NFT dashboard is a display for all the digital assets in the marketplace, open for the users to trade them. A number of the items accessible in the dashboard are the NFT price list, NFT description, NFT Categories, etc. However, the market is much more exciting upon development.
How to collect marketing analytics data Conduct customer surveys. How to analyze marketing data ? How to leverage Userpilot for marketing analytics: Track in-app events to understand user behavior and spot high-engagement areas. Create custom analytics dashboards to track your key metrics over time. Track in-app behavior.
Speaker: Miles Robinson, Agile and Management Consultant, Motivational Speaker
Dashboards and analytics can really set your application apart, but that doesn't mean you can implement them and forget about them. Join Miles Robinson, former UX and Design Manager, as he explains the different ways to refresh your dashboards - and how to determine what's the best path to product dashboard success.
We organize all of the trending information in your field so you don't have to. Join 96,000+ users and stay up to date on the latest articles your peers are reading.
You know about us, now we want to get to know you!
Let's personalize your content
Let's get even more personalized
We recognize your account from another site in our network, please click 'Send Email' below to continue with verifying your account and setting a password.


Let's personalize your content