This site uses cookies to improve your experience. To help us insure we adhere to various privacy regulations, please select your country/region of residence. If you do not select a country, we will assume you are from the United States. Select your Cookie Settings or view our Privacy Policy and Terms of Use.
Cookie Settings
Cookies and similar technologies are used on this website for proper function of the website, for tracking performance analytics and for marketing purposes. We and some of our third-party providers may use cookie data for various purposes. Please review the cookie settings below and choose your preference.
Used for the proper function of the website
Used for monitoring website traffic and interactions
Cookie Settings
Cookies and similar technologies are used on this website for proper function of the website, for tracking performance analytics and for marketing purposes. We and some of our third-party providers may use cookie data for various purposes. Please review the cookie settings below and choose your preference.
Strictly Necessary: Used for the proper function of the website
Performance/Analytics: Used for monitoring website traffic and interactions
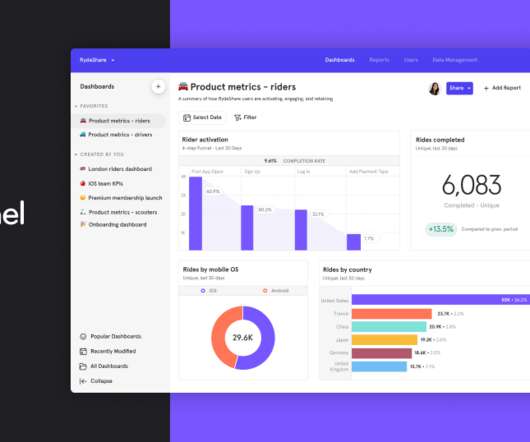
In SaaS, a new user activation dashboard can become a massive product analyticstool to understand and optimize the user journey. But how can a dashboard for user activation can help you engage more users? moment ," where the core value proposition of your service becomes clear and tangible.
Everyone talks about getting insights from digital products and processes, yet I’ve seen it done wrong so many times that the subject demands revisiting, especially in light of the emerging field of DataOps. Data is increasingly complex and complexity can only be managed via stable and reliable foundations. What is an Insight?
Which product analyticstools should you be using? How many analyticstools do you need? And what type of analytics really matters for a product marketing manager? By the end, you'll know the only type of analyticstools you really need as a PMM. What is product analytics?
And I love graphs, metrics, and the data that powers them because they communicate results and inspire ideas. And at the heart of the OKR system lies metrics and data. So I took these and worked with our data science and customer success teams to understand the product metrics (KPI’s) that influence these results the most.
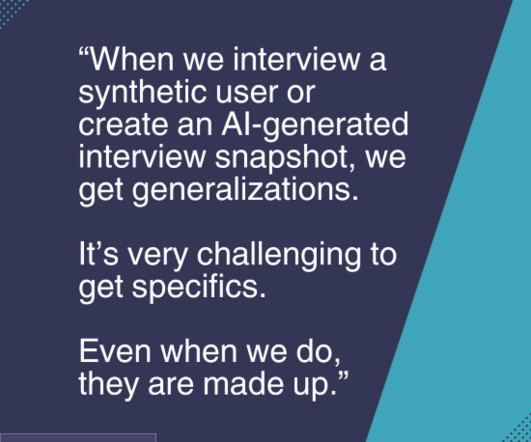
I’m disappointed to see the rise of generative AI tools that are designed to replace discovery with real humans. I break the underlying structure of discovery into three parts: Starting with a clear desired outcome —in other words, starting with a clear definition of success. Everything we do in discovery is in service of that.
Without product analytics, how do you know how to move the needle with your product growth? If you’re only beginning your adventure with product analytics, looking at all the usage data may seem overwhelming at first glance: Source: Heap. Here are the need-to-know takeaways: What is Product Analytics?
You need more data: What’s the baseline for improvement? Let’s unpack retention analysis for product managers, from high-level goals (what to prioritize) to actionable tips for retention analysis (how to segment retention data) in Mixpanel. There is, of course, no simple answer. How do you define retention for this product?
Have you noticed recently an increase in the usage of the terms ‘data-driven’, ‘data-informed’, and ‘data-inspired’ around your office? What does data-inspired actually mean and how is it different from being data-informed? Data-driven, data-informed, and data-inspired describe how data should be used.
When identifying your key performance indicators (KPIs), it’s crucial to tailor the exact definition to your business. No stock definition or out-of-the-box dashboard can capture this for you. Summary KPIs vs. Growth KPIs. Step one is to define the Growth KPI in your analyticstool.
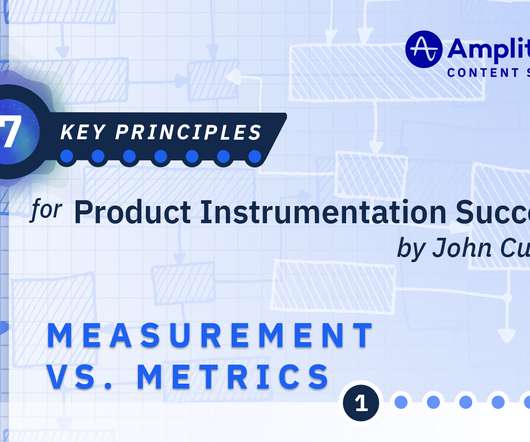
Worried they will track the wrong metrics, and pick the wrong KPIs. Worried that they’ll end up with unusable and untrustworthy data. Learning how to “see” data. Unlocking the long tail of insights & t-shaped instrumentation. Steps (a big deal for Fitbit users, maybe more of a KPI). Measurement vs. Metrics.
Similar to downloads, tracking new signups can yield interesting insights. It is an indispensable KPI because it indicates how many of your users have stayed loyal. . This metric is difficult to grow organically; therefore, retention numbers should be a major KPI from day one. Churn rate is the opposite of retention rate.
The foremost way companies know which features to allocate their time toward building is by establishing key performance indicators (KPIs). Everything should always go back to the data and metrics! As companies usually have many different KPIs, maintaining or growing customer retention is a key KPI that each business commonly shares.
Our product was a script that you put on your website so it unblocks your analytics when they are blocked by any kind of content blockers. The big issue was that in the context of very low budget, the extra data was just a nice-to-have for marketing teams. We were definitely not a pain point. It wasn’t helping them much.
That’s what real-time analyticstools can provide. What is real-time analytics? According to Gartner, real-time analytics means that the analysis happens within seconds after new data is received. Apps aren’t predictable once you release them into the real world. Time is not on your side.
Recommended product manager job openings in data-driven companies 1. A professional with strong analytical skills, capable of leveraging datainsights to drive strategic decisions. Analytical mindset, proven experience working cross-functionally to turn datainsights into strategic decisions.
UserTesting’s Product Insights proposes digging deeper to understand not simply the most engaged users, but those who’ve found something in your product that transforms the way they think. Many teams might immediately jump to finding solutions that will help move toward that KPI. These are the customers we want to serve and replicate.
In the world of SaaS (software as a service) it usually comes down to one person who devises a strategy for developing and unraveling a perfect product. Everyone in the team, from CEO to copywriter, needs to be on the same page when it comes to your company’s definition of successfully reached goals. pretty much everything.
When identifying your key performance indicators (KPIs), it’s crucial to tailor the exact definition to your business. No stock definition or out-of-the-box dashboard can capture this for you. Summary KPIs vs. Growth KPIs. Step one is to define the Growth KPI in your analyticstool.
Related metrics that impact your revenue and how to use the insights to turn your product into a growth engine. It serves as a key performance indicator (KPI) for evaluating the effectiveness of various business strategies. This helps users see the ROI of using your tool and boosts your overall revenue growth rate.
Investing in the quality of your customer support experience is one of the most powerful ways to grow your company, but every company’s definition of “quality” is different. The result is the Customer Support Quality Benchmark Report 2021. How the support landscape is changing. Chat has passed phone support.
Or that an OKR is the same as a KPI. In 2013, Norman updated and expanded his book to be more inclusive of digital products and services, to reflect the shift from hardware to software. The UX Honeycomb Peter Moreville created a brilliant visualization of the seven essential aspects of great UX. That’s a big mistake!
Customer feedback surveys serve as invaluable tools for gathering actionable insights directly from your audience. However, it’s important to know when and how to trigger the forms to gather user feedback , for increased response rate and data credibility. Track overall satisfaction with your product or service.
Are you tracking the right Product Marketing KPIs? With so many product growth insights available to every product marketer, it’s sometimes hard to understand which metrics are relevant and which you should be tracking to measure the success of your product marketing. What is a Product Marketing KPI metric?
SaaS businesses thrive on data. But data alone doesn’t make much sense. This is where analytics software comes in. Analyticstools help SaaS businesses generate actionable insights from the data they collect, which then fuels their decisions. But what data should you analyze and how?
As product usage analytics deliver a growing stream of data and insights into product team dashboards, user retention metrics have become an increasingly reliable KPI to measure customer, product, and company health. Churn Analysis Definition in Usage Intelligence. A longer time frame is more appropriate.
Customer obsession is table stakes, but a top-notch product manager must also be adept at using data to understand how to shape the future of the product. They rely on a growing array of tools to manage the process and ensure senior management has visibility into product’s contributions. What’s the difference? Centralize. Communicate.
PMs will then ask for more dashboards, but whenever they need to explain why a metric changed they say they’ll “get back to that next meeting” (and they never do). Bad product teams make decisions based on a best guess from recent and anecdotal evidence, reserving analytics resources only for ‘mission critical’ questions.
This experience reminded me a lot of my work as an analytics leader at AT&T. Hear me out: In my role, I’m tasked with working stride-for-stride with the product teams across our large company to arm them with the datainsights needed to improve their products. What does data democratization look like?
You need more data: What’s the baseline for improvement? Let’s unpack retention analysis for product managers, from high-level goals (what to prioritize) to actionable tips for retention analysis (how to segment retention data) in Mixpanel. There is, of course, no simple answer. How do you define retention for this product?
This experience reminded me a lot of my work as an analytics leader at AT&T. Hear me out: In my role, I’m tasked with working stride-for-stride with the product teams across our large company to arm them with the datainsights needed to improve their products. What does data democratization look like?
Similar to downloads, tracking new signups can yield interesting insights. It is an indispensable KPI because it indicates how many of your users have stayed loyal. This metric is difficult to grow organically; therefore, retention numbers should be a major KPI from day one. Churn rate is the opposite of retention rate.
If we’re being honest, it is very difficult to create a culture that values data. I frequently see leadership teams purchase analytics software hoping that this new access will make everyone excited to use data regularly. Teams need to use data to make better decisions. Integrate Data into your Everyday Language.
To do this, you should consider sharing: Data from preceding experiments/features that make a case for this feature A business imperative that is internal to your own company (e.g. preset quarterly goals or strategic need to focus on a new KPI) A broader change in your industry and/or prototypical customer’s life (e.g.
One of the main advantages of working in many machine learning products is the ability to simulate a scenario based on historical data by performing offline experiments. In order to perform offline evaluation, data is collected from the live system that you want to simulate. Let’s dive into it. How does offline experimentation works?
In a business setting, KPIs can be used to manage the efficiency of your Operational Capabilities — our Service, Support, and Customer Success teams, and our basic “keeping the lights on” operations. But KPIs can only help us target and measure part of the story. This is where OKRs can provide additional benefits.
Freestyling Amongst the product leadership team, they will need to decide that they are committed to more structure/standardization, engagement with their direct reports on career development, and time to review advancement candidates. liking to UX studies, mockups, and KPIdashboards).
It all starts with a clear hypothesis on who the target audience is for your product or service. Before getting into the specific solution your product or service provides, it's important to have a clear understanding of the specific problem or pain point that your solution solves for. Target Audience. Problem You're Solving.
It’s been just over a year since Moritz joined NBC, and we spoke to him about his process of redesigning the storied news organization’s digital properties from the outside in, why audience loyalty is his number one KPI and how he’s improving the monetization efforts of sites like msnbc.com and today.com. Here’s our interview with Moritz.
Understand the real impact of change- In an organization where many teams are taking on various initiatives to effect a KPI, it is very hard to attribute the exact impact of each change. An MVT is the most efficient but valid way to gather data regarding a hypothesis. Analyze the results for insights not to declare ideas as winners 6.
They focus on learning how successful the services, features and capabilities to discover opportunities to take that performance to higher levels. Every calculation has a clear definition • good metrics are simple to understand and easy to measure • are used to measure things of interest Example: • Avg.
This experience reminded me a lot of my work as an analytics leader at AT&T. Hear me out: In my role, I’m tasked with working stride-for-stride with the product teams across our large company to arm them with the datainsights needed to improve their products. What does data democratization look like?
In this article , Mixpanel’s VP of Product and Design, Neil Rahilly, outlines his crucial steps for setting, achieving, and celebrating data-informed goals. Measuring what matters: using growth KPIs to gain insight into your product’s future. No stock definition or out-of-the-box dashboard can capture this for you.
There are lots of tools in the market to measure and improve your customer experience. The 3 best tools are Userpilot, Qualtrics, and Mixpanel. What are customer experience KPIs? Customer Experience KPIs (key performance indicators) refer to key business metrics that track various aspects of customer experience.
Photo by Javier Allegue Barros on Unsplash “PM”ing your KPIs In Beyond Vanity Metrics , I issued a call to action to pick a KPI that is unmeasurable. By my personal definition of better. You test the new checkout flow of your eCommerce site and you get a definitive answer to whether it increases revenue. More connecting.
We organize all of the trending information in your field so you don't have to. Join 96,000+ users and stay up to date on the latest articles your peers are reading.
You know about us, now we want to get to know you!
Let's personalize your content
Let's get even more personalized
We recognize your account from another site in our network, please click 'Send Email' below to continue with verifying your account and setting a password.


Let's personalize your content