This site uses cookies to improve your experience. To help us insure we adhere to various privacy regulations, please select your country/region of residence. If you do not select a country, we will assume you are from the United States. Select your Cookie Settings or view our Privacy Policy and Terms of Use.
Cookie Settings
Cookies and similar technologies are used on this website for proper function of the website, for tracking performance analytics and for marketing purposes. We and some of our third-party providers may use cookie data for various purposes. Please review the cookie settings below and choose your preference.
Used for the proper function of the website
Used for monitoring website traffic and interactions
Cookie Settings
Cookies and similar technologies are used on this website for proper function of the website, for tracking performance analytics and for marketing purposes. We and some of our third-party providers may use cookie data for various purposes. Please review the cookie settings below and choose your preference.
Strictly Necessary: Used for the proper function of the website
Performance/Analytics: Used for monitoring website traffic and interactions
Atif brings valuable insights from a recent PDMA executive workshop where leaders discussed their real-world challenges with strategic decision making and innovation strategy. In this episode, he shares some insights from that workshop and his experience in product leadership.
Put simply, we craft smart products that transform mundane shopping experiences into personalized adventures, like suggesting the perfect pair of sneakers based on your unique sports styleall thanks to Predictive Analysis. Curious to learn more? Keepreading! So, how does everything unfold?
You reach out to all department heads and request to get data for your analysis: Marketing team for data on campaign conversion, customer support for data on call volumes, account team for data on customers feedback, product data for usage, etc. What is a product operations dashboard?
This definition is a mouthful, so I like to visualize it. I’m going to walk through this visual quickly, and then Cecilie and I are going to dive into this in more depth. Using the Opportunity Solution Tree to Guide Discovery The visual at the center of this is called an opportunity solution tree. It’s that simple.
How Companies Are Funding User Research in 2025: Insights from the User Interviews Research Budget Report User Interviews 2025 Research Budget Report is a crucial resource for understanding how modern organizations are approaching the financial side of user research. Only 17% experienced reductions. Lets unpack each.
Lisa began her career in data science and spent four years as a data scientist at Airship , a marketing and messaging automation company. During her tenure as a data scientist, Lisa built two predictive products. Lisa says, “We led with ‘What can we predict?’ Tweet This. Tweet This.
What is data-driven analytics in SaaS? How to conduct user data analysis? What are the best analyticstools for the job? TL;DR Data-driven analytics describes the process of collecting, analyzing , and interpreting customer data to help organizations make better-informed product and strategic business decisions.
From Raw Data to Clarity — Cleaning, Sorting, and Synthesising Insights Part 4 (of 5) of the UX Research Playbook series Synthesising qualitative data is similar to reaping the harvest after the diligent effort poured into research — it’s the step where hard work blossoms into meaningful insights. Mural , Miro , etc.)
But figuring out which sales tools you should buy and invest in – let alone what each tool even does – can be a daunting task. This is especially true when you consider the seemingly endless list of sales tools to choose from. Before we begin: how to choose your sales tools. Better tools, not more tools.
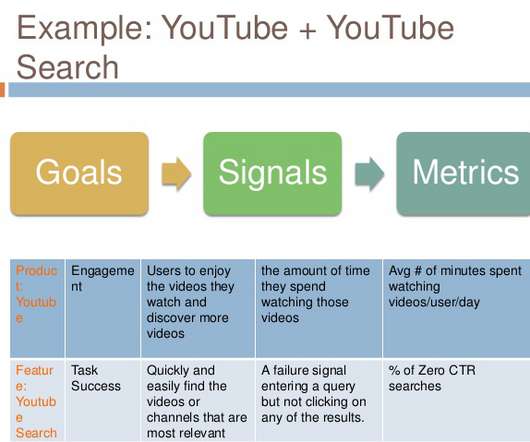
Measuring design outcomes is a vital exercise that every product team should practice. You can use tools like Google Analytics to track the average session duration and time on specificpages. Average time on page in Google Analytics. Metrics: Number of product changes based on research insights. New course alert!
The article here focusses on business criterion to use to better evaluate if a predictive model is ready for production and the associated risk when the predictions are wrong. Optimized for better outcomes Today, businesses regularly use predictiveanalytics to optimize their business and achieve better business outcomes.
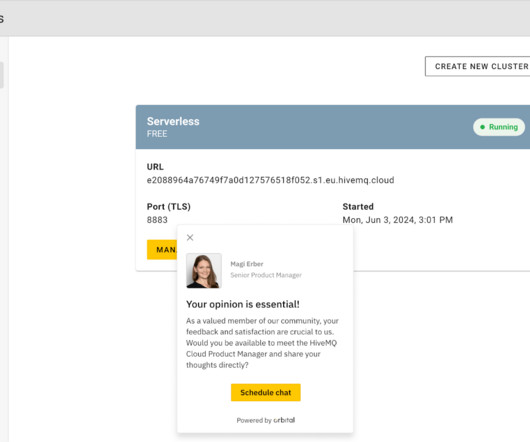
For today’s Tools of the Trade , we caught up with Yury Oleynik , the VP of Product Management at HiveMQ , who has managed to make continuous interviewing a reality on his team. Yury shares a few of the tactics his team tried to automate recruiting before they came across the tool they’re currently using, Orbital.
Data analysis is integral to a product manager’s job – it’s what helps them build impactful products. This article dives deep into data analysis for product managers. User data analysis helps: Provide direction for product development , allowing for effective resource allocation. What is data-driven product management?
Instead, we must go back to the age-old mantra that a picture is worth a thousand words and provide a visual representation of what the future could look like if we are successful. Design: Customer Discovery Insights. Whenever you are surprised it means you've collected a valuable insight. Design: Product Roadmap.
“We are a data-driven company”. And, while the logic behind a data-driven approach is undeniable, too often the expectations that come with it aren’t met. And, while the logic behind a data-driven approach is undeniable, too often the expectations that come with it aren’t met. Improper Testing.
Tired of spending big on third-party data providers and not getting the results you want? Say hello to direct data capture! By collecting data directly from your customers, you can cut down on costs, gain accurate insights, and maintain full control over your data. Gather direct data with user interviews.
And this is why it can be helpful to consider the tools that will best support you in building your continuous discovery practice. Let’s be clear: The tools alone won’t automatically make you better at discovery. Since there are countless ways of approaching this, we’re kicking off a new series, Tools of the Trade. Tweet This.
Some fundamental principles I found helpful when starting this exercise, Keep it short and sweet so that you can quickly memorize the core message. Overall, some valuable lessons captured from this exercise, “How does this strategy framing help translate into actions?”. As with any tool, there is a downside when misused.
Let’s face it: qualitative data analysis is vital to understanding why users act in a particular way and how they feel about your product in a way that quantitative product analytics can’t. This article will teach you how to analyze qualitative data to inform product development and improve the product experience.
One of the best ways to learn to truly collaborate is to visualize your thinking. This is why in my book Continuous Discovery Habits , I encourage teams to visualize their thinking with each habit. The best teams: Create experience maps to visualize what they individually and collectively know about their customer.
TL;DR A business intelligence (BI) analyst is a data specialist who helps businesses translate raw data into actionable insights. According to Glassdoor data, the estimated total pay for a Business Intelligence Analyst in the United States is $134,912 per year, with a base salary of $99,503 and additional pay of $35,409.
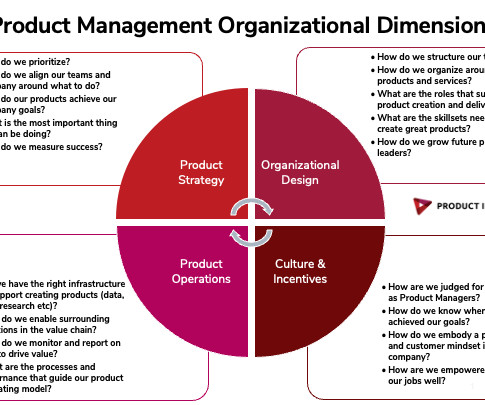
Being a product manager in a B2B service company, the question was particularly difficult to answer. It was a mind expanding exercise and set a clear structure for me to rethink what is really the differentiation factor in our product. . It is a good tool to have and can be used over and over again. .
How can you balance functionality with aesthetics, ensuring your app is both intuitive and visually appealing? Benefits of responsive e-learning appdesign Firstly, why do you need a functional design in the app where people study focusing on educational materials, not visuals? Examples include Moodle and Blackboard.
Data PM: organizations dealing in data products (building AI/ML based products) prefer a PM with data science background so that they can appreciate the problems well and being able to work with data engineers/scientists. Hence roadmapping is a crucial exercise which can make or break your product. Product Roadmap.
A use case is how customers use your product or service to derive value of some kind. It forces us to focus on the right use cases and get data to validate internal assumptions. It forces the product team to do a normalization exercise—take pieces of data that may not all be consistent and create a unified use case.
I gather data through surveys about observations. Lots of data goes into pinpointing. Below is a brief overview of the framework that I use and a few signs of where you should start if you want to run this exercise yourself. Leadership is frequently involved in lower-level discussions or asks for ad-hoc reports.
He most recently ran Product Management, Marketing, and Partnerships across Square while reporting to the CEO. Instead of placing all the burden on the manager, we need to shift our analytic lens upward, onto the skip. Running through this exercise has two key caveats. skip reports) with the next principle. Subscribe now.
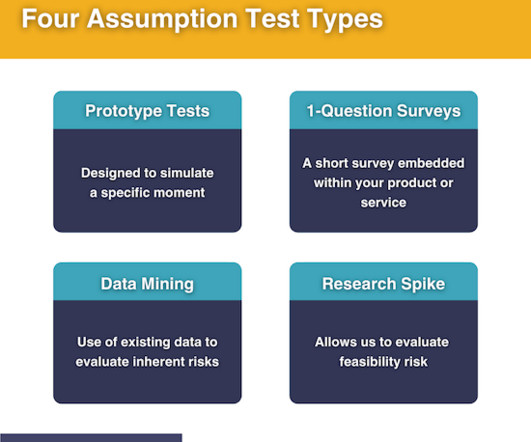
What tools should you use to test your assumptions? Do a data audit and examine the ethical assumptions related to your data policies. Data mining: the use of existing data to evaluate the inherent risk in an assumption. In his book Testing Business Ideas , David Bland shares an exercise called assumption mapping.
Customer loyalty(retention): With a mobile onboarding tool such as Userpilot , you can send regular prompts, personalized content, and thoughtful push notifications, and keep satisfied users returning. Then plot those moments in a single visual map. Finally, attach KPIs so each leak shows up in the data before it hurts user retention.
And finally, Tali was so convinced of the power of opportunity solution trees that she started leading workshops at product events to teach others how to use this tool. I myself am a visual thinker, and a big believer in external representations as a tool to create common ground (as Barbara Tversky is quoted in Teresa’s book).”
Ada and I both had the privilege of working at two data-driven companies, LinkedIn and SurveyMonkey , led by two analytically rigorous leaders, Jeff Weiner , and the late Dave Goldberg. Those experiences shaped the way that we both now think about building an effective data-driven product culture. Why metrics reviews matter.
Discover how to enhance user experiences by leveraging quantitative research, usability testing, and A/B testing to make informed, data-driven design decisions that lead to measurable results. These tools enable you to collect feedback and use that data to refine your product’s design and functionality.
“Successfully managing complex sales requires a different level of visibility into your deals” To get visibility into large deals, I developed a visual framework – which I call the Agile Arrow – that applies popular project management principles to the work that we do as salespeople. Act II: Building a visual framework.
It has also changed how we interact with our favorite stores, restaurants, and service providers – even our healthcare providers. According to State of the Connected Customer , a report from Salesforce, 84 percent of customers say the experience a company provides is as important as its products and services. Helpfulness.
Referring to people as product owners who do not manage a product and do not exercise the right ownership is wrong in my mind: It creates confusion and it sets wrong expectations: Someone who owns a product part cannot take on the responsibility of maximising the product’s value and achieving product success.
To help hiring managers and recruiters, like myself, decide whether or not to interview you, it can be a great exercise to treat your resume like a professional product. Data-Driven. As a hiring manager, I want to hire people focused on gathering good data, s o we can craft good hypotheses about what to build next.
Chris shared the story of how he introduced the opportunity solution tree to several teams at his company and a few of the iterations that helped make the tree an indispensable tool at SuperAwesome. He works at SuperAwesome, a UK-based company that develops tools and services to make the internet safer for kids. Tweet This.
These are some of the most common data analyst interview questions. ✅ Verified : Celine Liu , Uber's former Global Analytics Lead, wrote this guide. Celine has conducted 100+ interviews across analytics, operations, and strategic roles. 🧠 Learn more : Check out our complete data analyst interview prep course.
Whether you're an aspiring entrepreneur, a seasoned product manager, a UX designer , or simply curious about the process, this guide will walk you through the essential steps, best practices, and tools you need to create successful products. Continuously iterate your product based on data. Follow an agile mindset.
It was a good ceremony :) We are going to learn what has made Hershey an outstanding innovator, gaining insights that might help you and your organization. We decided to pursue the OCI award as a learning exercise and a moment of inspiration for the company. 10:08] Is there a tool you use for aligning projects to your strategy?
3:18] You made a move from being a senior product manager in the medical industry at a company creating surgical implants to being the senior director of product management for an IT services company specializing in web hosting. At Newfold Digital, we acquire a lot of companies that specialize in a product or service.
Symmetrical landing page structures which popular web-building tools offer may not always deliver the conversion you expect if you do not understand the mechanisms behind them. Unfortunately this is a limitation due to the unavailability of the conversion data. Photo by ?? ?? Social Proof —this refers to social pressure or validation.
The research mostly focused on prototyping and exploring visual concepts, but little was done in the realm of talking to end users and customers. While these efforts brought some beautiful, iconic visuals to life, they didn’t provide insight into how their users really interacted with the design system.
Measuring design and utilizing data are essential steps towards creating a sustainable product. Let me show you how to use data to improve your product. The answer is out there, and it lies in data. Metrics help turn data into digestible information, which can help in drawing conclusions and making decisions.
We organize all of the trending information in your field so you don't have to. Join 96,000+ users and stay up to date on the latest articles your peers are reading.
You know about us, now we want to get to know you!
Let's personalize your content
Let's get even more personalized
We recognize your account from another site in our network, please click 'Send Email' below to continue with verifying your account and setting a password.


Let's personalize your content