This site uses cookies to improve your experience. To help us insure we adhere to various privacy regulations, please select your country/region of residence. If you do not select a country, we will assume you are from the United States. Select your Cookie Settings or view our Privacy Policy and Terms of Use.
Cookie Settings
Cookies and similar technologies are used on this website for proper function of the website, for tracking performance analytics and for marketing purposes. We and some of our third-party providers may use cookie data for various purposes. Please review the cookie settings below and choose your preference.
Used for the proper function of the website
Used for monitoring website traffic and interactions
Cookie Settings
Cookies and similar technologies are used on this website for proper function of the website, for tracking performance analytics and for marketing purposes. We and some of our third-party providers may use cookie data for various purposes. Please review the cookie settings below and choose your preference.
Strictly Necessary: Used for the proper function of the website
Performance/Analytics: Used for monitoring website traffic and interactions
This post is about making these ideas concrete through a set of guidelines, templates, and JIRA+Excel tips so you can create effective status and progress reports quickly, have less meetings , and get out of the building , which is where you need to be. Templates and tips for less status meetings. Progress / Status.
What we want is to create a culture where stakeholders come to us with problems, rather than ready-made ideas and solutions (i.e. Yet, I wanted to dig deeper into this issue by focusing on: The reasons why a Solution-first culture makes your life harder; A “framework” to drive stakeholders to think in terms of Problems. features.).
This report contains data from the following app categories: Finance. Personal Services. Business Services. Mobile consumer feedback changed product roadmaps, improved ROI, drove revenue, and got companies closer to achieving their overall business goals. Food and Drink. Healthcare. Media and Entertainment.
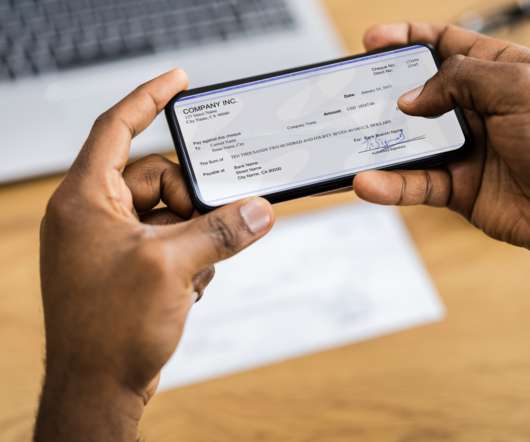
The following data and information on Business Services apps is from our 2022 Mobile App Customer Engagement Report. Brands in Business Services had varied experiences in 2021. Below is a short summary of how Business Services apps fared in 2021. DOWNLOAD THE FULL 2022 BENCHMARK REPORT HERE.
Think your customers will pay more for data visualizations in your application? Five years ago they may have. But today, dashboards and visualizations have become table stakes. Discover which features will differentiate your application and maximize the ROI of your embedded analytics. Brought to you by Logi Analytics.
Today, we’re thrilled to release our 2021 Mobile App Engagement Benchmark Report. Apptentive’s annual mobile app engagement benchmark report serves as a baseline to help you understand your app’s engagement strengths and areas for improvement. What’s New in the 2021 Report. See the Report. Go all in on personalization.
The following data and information on Shopping apps is from our 2022 Mobile App Customer Engagement Report. Subcategories for Personal Services Apps: Home and Family. DOWNLOAD THE FULL 2022 BENCHMARK REPORT HERE. Summary of Personal Services Apps in 2021. Download your copy here. Expressed customer emotion.
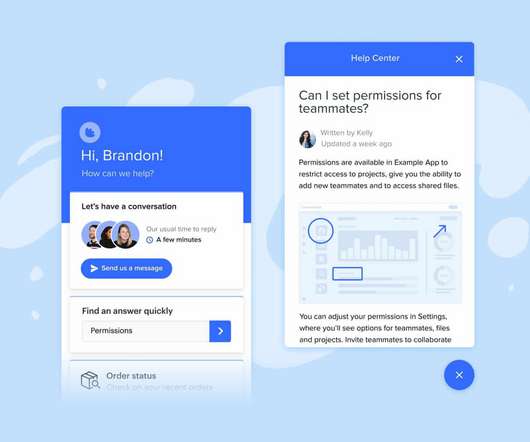
But in today’s fast-paced world, your customer support can only be as effective as the technology that underpins it. Juggling outdated, disjointed tools is a recipe for team burnout, customer dissatisfaction, and ultimately, churn. Download The Ultimate Modern Support Tech Stack guide. Strategy first, technology second.
You also might be reading this post thinking: “Who’s adding new tools to their tech stack right now?” Do you have the right tools to capture that voice? In order to help, we’ve taken the liberty of compiling a list of the best mobile in-app feedback tools for you. Core mobile in-app feedback tools & solutions.
Embedding dashboards, reports and analytics in your application presents unique opportunities and poses unique challenges. We interviewed 16 experts across business intelligence, UI/UX, security and more to find out what it takes to build an application with analytics at its core.
In a fastmoving digital economy, many organizations leverage outsourced software product development to accelerate innovation, control costs, and tap into global expertise. Table of Contents What Is Outsourced Software Product Development? What Is Outsourced Software Product Development?
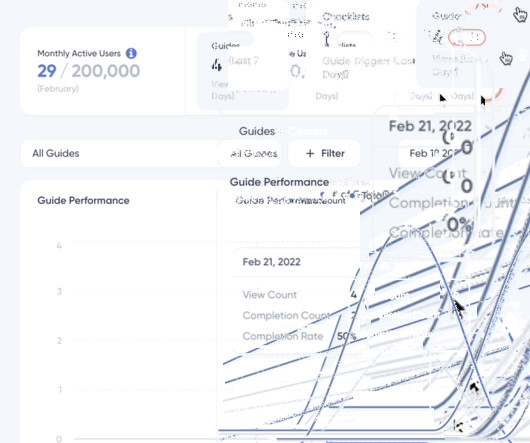
They track 47 different key performance indicators (KPIs) in their mobile analytics platform , spend hours debating dashboard numbers, yet can’t predict which users will churn next week The problem here isn’t a lack of data. Theyre choosing the right tool for the task. Cross-platform analytics data on Userpilot.
The following data and information on Media apps is from our 2022 Mobile App Customer Engagement Report. Subcategories for Media Apps: News, Telco, Technology, Games, Sports, Music. DOWNLOAD THE FULL 2022 BENCHMARK REPORT HERE. Technology (media creation, connectivity, etc.). Data included: Ratings and reviews.
As they wait for the downloads to come, they realize—all too late—the fallacy of this assumption. If you’re ready to submit your app to the app stores next week, condense the most important elements of pre-launch into a one-week period and move the other items to your post-launch roadmap. IDENTIFY INFLUENCERS AND REPORTERS.
Finance faces the same reality: bold, user-first design delivered through seamless digital platforms is what separates the leaders from those destined to become footnotes. Leverage Technology to ElevateValue If youre not yet using AI, machine learning or personalized insights, youre already falling behind.
You can ask me to change the color somewhere or put a button on a screen, and I will probably do that, but I really like to get challenging problems where I can do my research build prototypes, do user tests, and come up with a solution that will raise our product to the next level. Designers can help product people a lot.
The following data on mobile surveys and interaction and response rates is from our 2022 Mobile App Customer Engagement Report. While correlation isn’t causation, looking at overlapping data points can help us infer what bets paid off for mobile product teams, along with where they can adjust their roadmaps to improve.
We encounter tools along the way—some that are helpful and some that are not. I realized I was most excited about the solution and customer experience. The idea was to provide a free video streaming service and fund it with video ads inserted in the middle of the videos. I switched to product management and never left.
The following data and information is from our 2022 Mobile App Customer Engagement Report. DOWNLOAD THE FULL 2022 BENCHMARK REPORT HERE. How Advantis Credit Union Uses In-App Mobile Surveys to Drive Product Roadmap and Improve App Ratings. Download your copy here. DOWNLOAD THE FULL 2022 BENCHMARK REPORT HERE.
The CEO joining us is Matt Young, CEO of UserVoice, the first product feedback and research tool for software companies. UserVoice is the tool I see most frequently used for collecting customer feedback and prioritizing customer needs to help product managers create more valuable products. We user our own tool at UserVoice.
We’ve outlined some of the unique challenges financial institutions commonly face, some suggested solutions, and examples of companies who have excelled in conquering these obstacles. Only 25-40 percent of new customers re-launch apps a week after download. Increasing customer retention.
Its about building a repeatable system that drives discovery, boosts engagement, and keeps users coming back. Its a system to make your app discoverable, shareable, and credible without relying on blind luck or paid ads alone. Here’s how to build that system: 1. User acquisition isnt a one-time campaign.
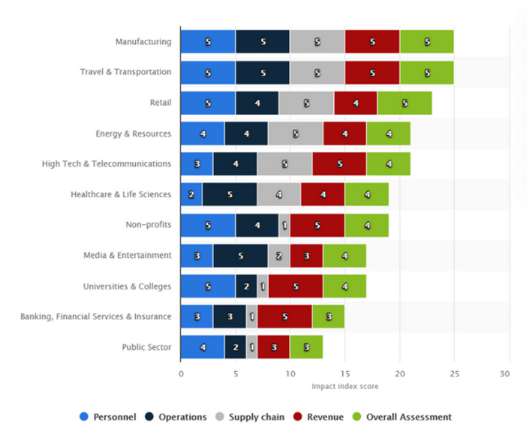
According to a report by Statista , this is how various industries have been impacted by the pandemic. Read the full DAU report for all industries here. According to Statista’s report, this industry was the second most impacted by COVID-19 – and for obvious reasons. Food & Beverage (including QSR).
We know NPS can be a powerful tool if used correctly, and recognize the value in having one metric to provide a holistic pulse on your customer experience. Download the guide: 6 Actionable Steps to Improve NPS. Roadmap prioritization and feature adoption (or lack thereof). How easy was it to report issues you encounter?
Picking the right product experience platform is an important task for any product manager. In this article, we’ll be conducting an in-depth analysis and comparison of the 15 best tools currently available on the market. If you’re looking for an all-in-one tool with great pricing, then give Userpilot a go. Let’s dive in.
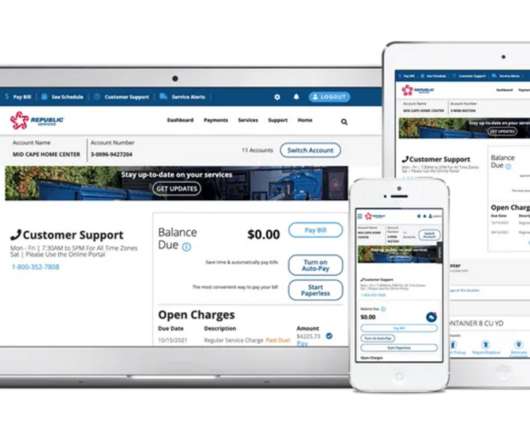
The following data and information on Utilities apps is from our 2022 Mobile App Customer Engagement Report. “Mobile has been a huge enabler of these heightened expectations, largely replacing the customer service agent of the past. DOWNLOAD THE FULL 2022 BENCHMARK REPORT HERE. Download your copy here.
Or at least, technologies such as open source bug tracking enabled developers to do amazing things. And those bugs are the reason, why we need to use bug tracking systems in order to find, document, and solve these bugs. Open source solutions are a great and easy way to make yourself familiar with a new topic. Communication.
We get it–your days are packed with roadmap review meetings, brainstorming sessions, and making (what sometimes feels like) too many PowerPoint presentations. We’ve been crunching the numbers, analyzing the trends, and distilling them into bite-sized insights so that you can have the tools you need to thrive as a product leader.
The following data and information on Travel apps is from our 2022 Mobile App Customer Engagement Report. But what about all those times when one of our famous customer service Red Coats isn’t right around the corner? DOWNLOAD THE FULL 2022 BENCHMARK REPORT HERE. Download your copy here. Expressed customer emotion.
Apptentive published our 2020 Mobile App Engagement Benchmark Report for Finance apps in early March, right as COVID-19 hit North America hard. The data in the report is from FY 2019 and serves as a yardstick to help app publishers measure customer emotion and understand what’s changed. You can download the full report here.
Christy and Ashley share findings from Apptentive’s annual mobile app engagement benchmark report , which is based on data from more than 1 billion mobile consumer voices. Want to download the slides from the webinar? They share insights applicable across the mobile landscape, as well as benchmarks specific to your industry.
That’s why we are so proud to announce we have been named a “Strong Performer” in The Forrester New Wave™: Conversation Automation Solutions Q3 2022. Forrester New Wave reports are guides to emerging technology spaces or solutions, in which they compare the vendors and evaluate them on certain transparent criteria.
In our 2022 Mobile Customer Engagement Benchmark Report , a study of more than 1,000 apps across a billion mobile app installs, we take a close look at apps in the Healthcare category. Healthcare apps are divided into three subcategories: Medical (public health, condition management, reproductive services, etc.) and Health Insurance.
Being responsible for the design of AI services used by millions of people is a huge responsibility, and Arin is deeply aware of that. In fact, he and his team even created a set of guidelines called “ Everyday ethics for AI” to help designers and developers create systems that are trustworthy. Fergal: Awesome.
TL;DR A SaaS product delivers software remotely, reducing the need for local installation, maintenance, and updates. Cloud computing offers three main service models: SaaS for ready-to-use software, PaaS for application development frameworks, and IaaS for scalable virtualized computing resources.
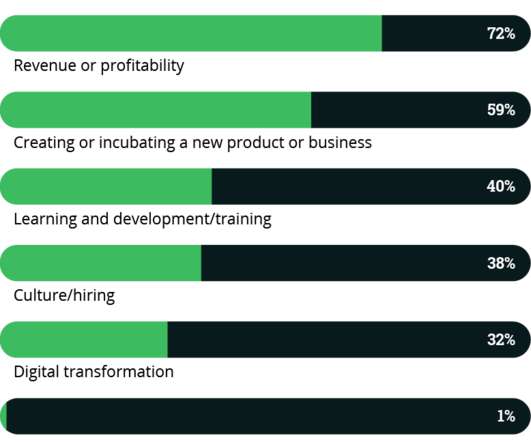
Today, we published the findings from our 2020 Product Management Insights Report , which highlighted the growing influence the product management discipline has over the toughest challenges facing organizations today, such as digital and strategic transformation.
This allows you to quickly make changes, pivot your product roadmap, and improve the customer experience before customers move on to your competitors. The best in-app feedback tools. According to our latest Benchmark Report , there was a 50% increase in the number of surveys sent in 2020 from 2019. In-app mobile surveys.
So, why does it often get deprioritized in favor of customer acquisition and app downloads? Retention rates are a strong indicator of whether or not your product or service is high-quality and valuable. If you see feature requests or bug reports for a certain feature, consider working it into your product roadmap.
While downloads are rolling in after months of development and a well-formed launch marketing plan, your mobile app adoption metrics show a concerning pattern: users sign up, look around, and quit the app almost immediately. Userpilot makes SaaS localization remarkably simple with AI-powered translation services. Congratulations!
Testing competitors’ solutions. Even without a test-ready prototype or a website in the initial phase of product development, you can get ahead by testing competitors’ solutions with the target group to gain insights on what to do better. Beginning of a project – test the current solution you want to improve or rethink.
Placed strategically, easy to spot, and asking the right question, it can help you improve your customer experience and ultimately your product roadmap. Let’s look at some of the tools you can use to create the best feedback button for your website and application. get ratings of your products or services.
In combining your loyalty experience with the mobile payment system, you’re removing friction from the buying process and therefore encouraging repeat business. Engaging with rewards members via mobile will help inform your product roadmap. On top of that, it’s reported 80 percent of those customers used mobile ordering at least once.
Customers have endless options when it comes to choosing new brands and services, which means their expectations are high. Listen to your customers wants and needs, then build solutions to meet those desires. Use feedback to drive your product roadmap. Validate feedback, and be kind while doing it.
Embedded analytics tools can help Enterprises centralize the information they have and perform different types of analysis , predictive modeling and forecasting, machine learning and AI, and other advanced analytical functionalities that will provide them with the insights they need to maximize ROI and strengthen their competitive advantage.
We organize all of the trending information in your field so you don't have to. Join 96,000+ users and stay up to date on the latest articles your peers are reading.
You know about us, now we want to get to know you!
Let's personalize your content
Let's get even more personalized
We recognize your account from another site in our network, please click 'Send Email' below to continue with verifying your account and setting a password.


Let's personalize your content