This site uses cookies to improve your experience. To help us insure we adhere to various privacy regulations, please select your country/region of residence. If you do not select a country, we will assume you are from the United States. Select your Cookie Settings or view our Privacy Policy and Terms of Use.
Cookie Settings
Cookies and similar technologies are used on this website for proper function of the website, for tracking performance analytics and for marketing purposes. We and some of our third-party providers may use cookie data for various purposes. Please review the cookie settings below and choose your preference.
Used for the proper function of the website
Used for monitoring website traffic and interactions
Cookie Settings
Cookies and similar technologies are used on this website for proper function of the website, for tracking performance analytics and for marketing purposes. We and some of our third-party providers may use cookie data for various purposes. Please review the cookie settings below and choose your preference.
Strictly Necessary: Used for the proper function of the website
Performance/Analytics: Used for monitoring website traffic and interactions
Collect customer data to calculate complex formulas for tracking metrics, monitor customer health scores, and resolve support tickets while continuously trying to improve retention and expansion. Top customer success management platforms for mid-market and enterprise companies. Defining a customer success tool and other FAQs.
Without effective UX analytics that goes beyond collecting data, you’re losing valuable customers. Why UX analytics should go beyond quantitative data. Methods for collecting and analyzing UX data. UX analytics involves gathering, analyzing, and interpreting data about how users interact with your product or service.
Reveal Embedded Analytics We know how difficult it is to create dashboards, especially for web applications. Thats what dashboards are for. In fact, Angular dashboards can provide key insights that will eventually allow data-driven decision-making at your company. What is an Angular Dashboard Library? Dont worry.
Custom dashboards to track key metrics at a glance. Analytics reports like paths, funnels, and cohort tables for visualizing user behavior data. for collecting user sentiment data. Pendo The dashboard on Pendo. Additional reports: You get a built-in Product Engagement Score dashboard. UserGuiding dashboard.
Large enterprises face unique challenges in optimizing their Business Intelligence (BI) output due to the sheer scale and complexity of their operations. Unlike smaller organizations, where basic BI features and simple dashboards might suffice, enterprises must manage vast amounts of data from diverse sources.
1 Userpilot for product teams to collect and act on NPS data Creating NPS surveys with Userpilot. Get real-time insights into your survey responses, with visual breakdowns of data, NPS score, and trends. Plus, the ability to create custom NPS dashboards allow you to analyze the results easily without writing a line of code.
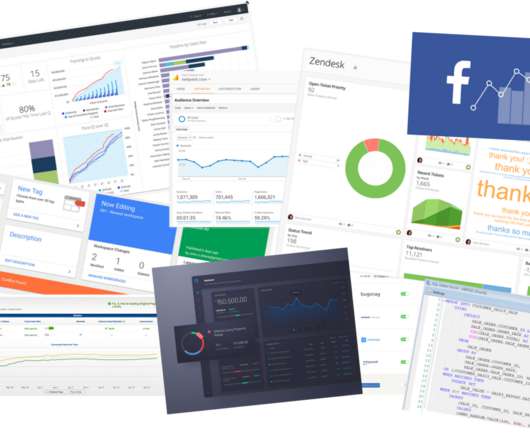
As you’re researching dashboard reporting tools, you’ve probably noticed how hard it is to find reliable information on the available solutions. To make your life a little bit easier and help you choose the best dashboard analytics tool for your SaaS, we’ve produced a guide of 12 excellent platforms available on the market in 2024.
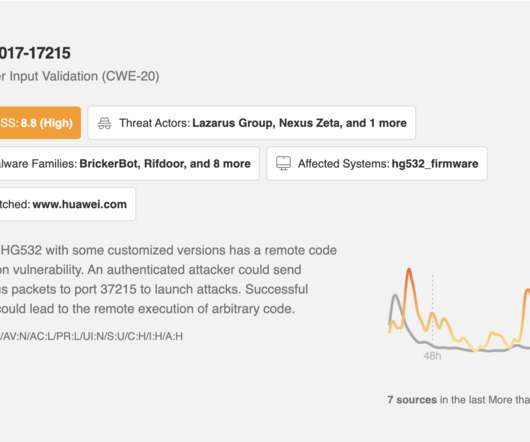
The consequences of missing critical information are astronomical, but no human can keep up with this onslaught of data on their own. All of this information is available at a glance via the Leo CVE Dashboard and throughout your Feeds. The Leo CVE Dashboard: a complete CVE overview in a glimpse. Try Feedly for Cybersecurity.
Todays guide takes a deep dive into session replay for enterprise companies. Once installed, a session replay tool tracks these DOM modifications and sends the data to its servers for processing and storage. How do enterprise teams leverage session replays? CAGR in the next couple of years. Well explore: The main use cases.
Chatbots (ChatGPT, Claude) Best for: Prototypes that are just one page and don’t have complex design requirements, like calculators, flip cards, or data visualizations Chatbots are capable of writing code in response to a question or prompt. file conversion, job applicant tracking) and data-driven applications (e.g.
But today, the underlying backbone of all of it is the right data. While science has always been part of sales, it’s hard to ignore the increasing importance of taking a data-driven approach to growing your business. As a sales rep, you need to be comfortable understanding the data behind your pipeline.
While observability is essential for identifying performance bottlenecks and ensuring reliability, unchecked data collection and storage costs can make it a financial burden rather than an enabler. However, in reality, only a fraction of this data is actionable, while the rest contributes to unnecessary costs and operational inefficiencies.
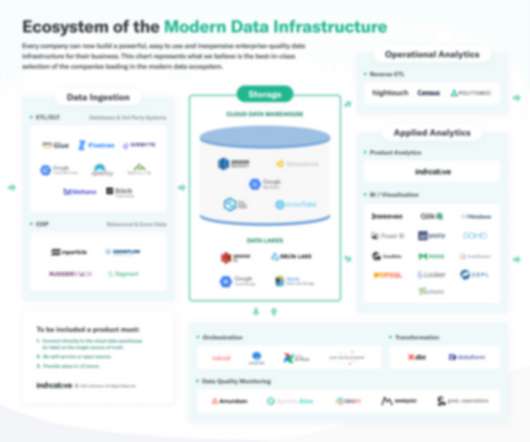
A simplified look at the current data landscape shows that an architecture where companies own and control their own data—where the data warehouse is the central hub connecting to all other tools and a gravity well for all business data—is emerging. The Traditional Approach to Data Architecture.
Generating data is easy. Data is often not accessible unless you can write code. People in non-technical roles rely on data every day to make decisions, develop ideas or measure success. When everyone on the team is empowered to understand data, they can make more informed decisions and measure their own success.
PLG for enterprise? As enterprise products tend to be complex, their value may be difficult to experience through free trials or freemium. Moreover, the enterprise sales funnel is more complicated than a product-led growth funnel. Personalized onboarding can help enterprise users learn how to best use the product in less time.
Gaming data is one of the most valuable sources of information out there. . You need an analytics solution and data strategy that can help make that information useful. . Indicative aims to help companies find more value in their data — and how those numbers tie back to key performance metrics — in your business. .
When you’re building a mobile product , data is your lifeline. What works for a startup might not scale for an enterprise. What works for a startup might not scale for an enterprise. Whether for tracking feature adoption or spotting drop-off points, the right analytics tool can make or break your growth.
Unlike traditional mobile web tools, Whatfix focuses exclusively on native mobile environments, allowing enterprises to create deeply integrated, in-app experiences that streamline user onboarding , feature adoption, and contextual in-app training. Who is Whatfix Mobile best for? reducing compliance risks and support tickets.
These tools help with improving retention, enhancing the user experience , and making data-driven decisions. When selecting a funnel tool, look for customization, integrations, segmentations , and dashboard options. Mixpanel is a great tool when you need excellent data visualization options from your sales funnel software.
mParticle is the customer data platform for brands leading the CX revolution. Unify data and simplify partner integrations with enterprise-class security and reliability. The integration between mParticle and Apptentive allows mobile app providers to build a bond with their customers through the data that defines them.
mParticle is the customer data platform for brands leading the CX revolution. Unify data and simplify partner integrations with enterprise-class security and reliability. The integration between mParticle and Apptentive allows mobile app providers to build a bond with their customers through the data that defines them.
Reveal Embedded Analytics We live in an era where data shapes decisions across industries. While data visualizations have become essential, not all standard visualizations cater to specialized reporting needs. With our innovative addition to the platform, you can now take control of the chart types available within your dashboards.
Are you struggling to make sense of scattered user data? Choose the best fit for your needs and transform data into actionable strategies. Tableau – the best data points visualization software. Hotjar – the best customer analytics software for heatmap data.
On top of that, Userpilot also offers in-app engagement tools you can use to act on the collected data. Autocapture events dashboard in Userpilot. Custom dashboards: Custom dashboards help you gather crucial metricslike average session duration, recurring revenue, or funnel conversions all in one place.
Data PM: organizations dealing in data products (building AI/ML based products) prefer a PM with data science background so that they can appreciate the problems well and being able to work with data engineers/scientists. Data vs Intuition. Hard Skills Required for the Role. A PRD needs no introduction.
By regularly checking your analytics data, you will proactively spot issues and find ways to resolve them. As you read through, you will learn the different UX data types and how to measure them. The data obtained is useful for user journey mapping and creating in-app experiences that make customers want to stick.
WalkMe Mobile is most suited for large enterprises and compliance-heavy industries. The company isn’t public about its pricing, but transaction data from Vendr shows the average annual cost is around $79,000, with larger contracts reaching over $400,000 per year. We could achieve nearly 95% data accuracy using WalkMe.”
But as we progressed in our customer discovery, we were able to refine our target audience hypothesis significantly by tightening the definition of our best customer to B2B sales professionals in large enterprises in the technology and financial services industries working in account executive or sales development roles.
You have the analytics data, but it doesn’t tell the whole story. Session replay tools then combine all this data to create movie-like playbacks of user sessions. Now , you might be thinking, “What about sensitive data like passwords or credit card numbers?” You know what users are doing, but not why.
Like any form of analytics, product marketing analytics is all about capturing key data and optimizing the customer experience using that data. TL;DR Product analytics is a process of collecting, analyzing, and interpreting product usage data. It starts tracking data from the moment a user first signs up for your product.
They combine quantitative and qualitative data to help businesses understand the big picture of their user experience. FullStory comprises of three main offerings: Complete Data Capture. FullStory is used by enterprises and large organizations but the platform has a few shortcomings: Mobile integrations. Product Analytics.
You can target specific segments, configure when the survey appears, and analyze results from the dashboard. Analytics dashboard: Track screen engagement, flow completion rates , and drop-offs. Segment-specific dashboards make it easy to measure whats working for each audience. Collect user feedback effectively with Userpilo t.
We live and work today in a world that is increasingly data-driven, but we cannot successfully adopt a data-driven approach to decision making without first identifying the metrics that matter most. As product managers, data is especially important at work where key metrics and KPIs are vital signs to our organizations and products.
Customer tier (enterprise vs. free trial). For example, let’s say a $100k ARR company (enterprise subscriber) reports their custom SSO integration is failing, a $10k ARR company reports dashboard loading slowly, and a $1k ARR company reports an issue with a new feature. No guesswork, just data.
And the behavioral data you do collect depends on what you choose to track and how you track it. Open up a webpage, drop in a script, and boom: clicks, scrolls, and form inputs start flowing into your dashboard without writing a single line of code. And if they reinstall the app, you lose whatever local data you had.
Scalability and security: Can the platform grow with your business and protect your data? Integrations Integrates smoothly with tools like Segment, Google Analytics, Mixpanel, and HubSpot, ensuring data flows seamlessly across your tech stack. Analytics dashboard in Userpilot. Session replays with Userpilot.
Since then, she’s helped grow the Udemy’s B2B SaaS arm to more than 5,000 enterprise customers, which include the likes of Pinterest, Adidas, and General Mills. Yvonne has taken a data-driven approach to international expansion, successfully avoiding the traps that have ensnared other startups.
From startups to enterprise-level tools, well break down the options, highlight their strengths, and help you find the best fit for your business. Limited quantitative analysis capabilities: Hotjars data visualizations are limited to heatmaps and funnel analysis reports. Event autocapture in Userpilot.
Does your business need more than session replays and quantitative data? PostHog : Opt for PostHog if you value open-source flexibility and data privacy, and have the technical expertise to manage, self-host, and customize open-source software. Customizable, no-code analytics dashboards with ready-made templates—similar to LogRocket.
Instead of juggling countless email threads or Slack messages, you manage everything from a central dashboard. When agents and product managers can quickly navigate the dashboard, they spend less time on training and more time resolving issues. 5 No-code editor, various module groups, segmentation, localization, analytics dashboard.
Userpilot offers three pricing plans: Starter, Growth, and Enterprise. The Enterprise plan is the highest-grade plan available on Userpilot, operating a quote-based pricing model. It is best for high-scale companies and enterprises seeking increased security and accessibility. Data capture and event tracking.
To make more data-driven decisions, let’s explore the top 6 alternatives to help you achieve that goal! Consider LogRocket alternatives if you require advanced behavioral data analytics, like A/B testing , sentiment analysis, and in-app follow-ups, or if you need a solution with a quick, no-code setup. LogRocket’s main dashboard.
The truth is that you need to find the silver lining between quantitative and qualitative data to analyze user behavior effectively. Quantitative data shows you what users are doing. Thats where qualitative data comes in. Quantitative data Quantitative data refers to insights that can be quantified and expressed using numbers.
Qualtrics XM helps you manage customer feedback at an enterprise level and comes with research features, too. Amplitude lets you dive deep into customer data and look back at historical customer behavior trends to inform decision-making. Userpilot helps you with customer engagement and data management. Dashboards in Userpilot.
We organize all of the trending information in your field so you don't have to. Join 96,000+ users and stay up to date on the latest articles your peers are reading.
You know about us, now we want to get to know you!
Let's personalize your content
Let's get even more personalized
We recognize your account from another site in our network, please click 'Send Email' below to continue with verifying your account and setting a password.


Let's personalize your content