This site uses cookies to improve your experience. To help us insure we adhere to various privacy regulations, please select your country/region of residence. If you do not select a country, we will assume you are from the United States. Select your Cookie Settings or view our Privacy Policy and Terms of Use.
Cookie Settings
Cookies and similar technologies are used on this website for proper function of the website, for tracking performance analytics and for marketing purposes. We and some of our third-party providers may use cookie data for various purposes. Please review the cookie settings below and choose your preference.
Used for the proper function of the website
Used for monitoring website traffic and interactions
Cookie Settings
Cookies and similar technologies are used on this website for proper function of the website, for tracking performance analytics and for marketing purposes. We and some of our third-party providers may use cookie data for various purposes. Please review the cookie settings below and choose your preference.
Strictly Necessary: Used for the proper function of the website
Performance/Analytics: Used for monitoring website traffic and interactions
This post is about making these ideas concrete through a set of guidelines, templates, and JIRA+Excel tips so you can create effective status and progress reports quickly, have less meetings , and get out of the building , which is where you need to be. Goals / KPIs. What’s the current status of our goal/KPI?
” Solution-centric data : “We’re making great progress; we’ve implemented 50 more user stories, and velocity is up by eight points!” ” Sadly, the data above is not helpful to see clearly how much value the product is creating. 2 Wrong Product KPIs. This often leads to too much data being gathered.
As the PM, your job is to find out how the campaign is performing, how the feature is working, how users are reacting to the new feature, what impact has the feature had your engagement and business KPIs, etc. That’s where investing time and energy into building an operations dashboard will pay dividend for years to come.
Listen to the audio version of this article: [link] A Product Strategy System The product strategy system in Figure 1 consists of four main parts: people, processes, principles, and tools. Are the right tools applied? Next, collect the relevant data. Are they properly empowered and adequately qualified? If so, what are they?
Experts predict the Customer Analytics market will top $24 billion by 2025. That growth is driven by a common difficulty facing many of today’s businesses—mountains of data and no way for non-technical people to make sense of it. That’s where Customer Analytics comes in. Common Customer Analytics Features.
“We are a data-driven company”. And, while the logic behind a data-driven approach is undeniable, too often the expectations that come with it aren’t met. And, while the logic behind a data-driven approach is undeniable, too often the expectations that come with it aren’t met. Improper Testing.
Modern customers expect quick, personal, and effective service. But with so much data to consider, how can you define the help desk metrics that matter for your team? But with so much data to consider, how can you define the help desk metrics that matter for your team? What are help desk metrics? Conversations per agent.
As you’re researching customer analytics platforms, you’ve probably noticed how hard it is to find reliable information on the available solutions. TL;DR Customer analytics platforms are specialized tools that allow you to collect and analyze data. Starts with Einsten Predictions’ $75/month billed annually.)
In SaaS, a new user activation dashboard can become a massive product analyticstool to understand and optimize the user journey. But how can a dashboard for user activation can help you engage more users? moment ," where the core value proposition of your service becomes clear and tangible.
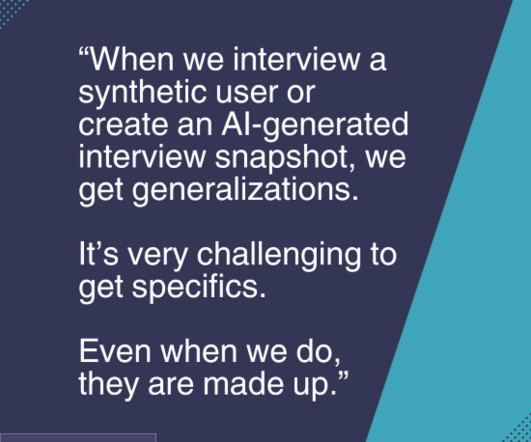
I’m disappointed to see the rise of generative AI tools that are designed to replace discovery with real humans. And I like to use opportunity solution trees to visualize our work to help us stay aligned on what we think we know. Everything we do in discovery is in service of that. Too many generative AI tools miss this point.
When it comes to boosting your product growth, user tracking tools can make your life a lot easier. They offer insights into product performance , what your users are doing inside your product, and why they are doing it. But how do you know you’re picking the right tools? Tableau is the best user datavisualizationtool.
Using KPIs and collecting the relevant data helps you balance intuition with empirical evidence. A Goal-directed Approach to Choosing KPIs. But the second part, acquire an initial user base , would require the introduction of a new KPI in order to understand if the acquisition goal has been met. Think of driving a car.
One look at your mobile app analyticsdashboard, and you just want to shut your eyes and scream in frustration. You aim to extract meaningful insights to improve app performance and user engagement. What decision will this data influence? Data is not fulfilling its value if it is not making an impact on your product.
Customer satisfaction analytics are key to understanding what makes your customers happy and building a product that retains users. But how can you leverage this user sentiment data to lead product development and grow your business? There’s no single KPI to measure customer satisfaction.
But today, the underlying backbone of all of it is the right data. While science has always been part of sales, it’s hard to ignore the increasing importance of taking a data-driven approach to growing your business. As a sales rep, you need to be comfortable understanding the data behind your pipeline. New business KPIs.
When it comes to KPIs vs metrics, which one should you measure to get better insights? Metrics and KPIs are often used interchangeably, but they also have differences. In this article, you will learn: What is a KPI in SaaS? Why is it so important to track KPI, metric, or measure? What about metrics and measures?
Do you need some behavioral KPI examples to understand what metrics to track and why? Behavioral key performance indicators (KPIs) can help you understand user experience and measure feature adoption. Then you can use its valuable insights to make data-driven decisions for your SaaS business. What are behavioral KPIs?
Global support teams can positively influence customer retention, especially if they provide service in their customers’ native language. Customers who receive a positive support experience from a company are 65% more likely to recommend that company to a friend. Improved global customer retention.
How do you deliver more insights out to more people? Operationalizing BI and analytics – that is, putting the power of data in the hands of everyone across the enterprise, not just analysts and data scientists – has always been the mantra for Birst co-founder Brad Peters. Do you see the bottleneck?
Without product analytics, how do you know how to move the needle with your product growth? If you’re only beginning your adventure with product analytics, looking at all the usage data may seem overwhelming at first glance: Source: Heap. Here are the need-to-know takeaways: What is Product Analytics?
To give you a general idea of where the mobile playing field is today, here are a few 2020 stats from our friends at App Annie : App Annie’s State of Mobile report is a fantastic place to start when looking for a general lay of the land and high-level stats. as well as from implicit data (favorited items, past purchasing behavior, etc.).
Similar to downloads, tracking new signups can yield interesting insights. It is an indispensable KPI because it indicates how many of your users have stayed loyal. . This metric is difficult to grow organically; therefore, retention numbers should be a major KPI from day one. Churn rate is the opposite of retention rate.
That conflict is easily manageable /if only that was so easy/ with introducing KPI/OKR adjustments for those departments and improving cross-functional processes. While structuring, we employ two tools at a time: first, we draw the scheme, since paper (or miro) does not have a memory limit, unlike the human brain.
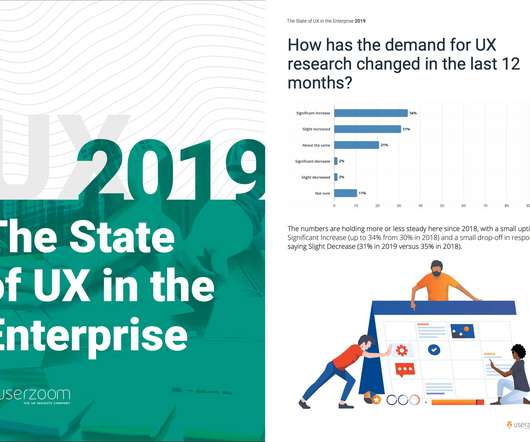
Therefore, I have asked six of UserZoom’s brightest minds (who also happened to be willing to stake their hard-earned reputations on these predictions) about how they think the CX and UX landscapes will shape up in 2020. UX Researcher, Professional Services. Becky Wright, Senior Product UX Researcher. Lee Duddell, Senior UX Director.
Recommended product manager job openings in data-driven companies 1. A professional with strong analytical skills, capable of leveraging datainsights to drive strategic decisions. Analytical mindset, proven experience working cross-functionally to turn datainsights into strategic decisions.
Having trouble deciding which customer serviceKPI to use? There are some vanity metrics among the KPIs for customer service. So let’s look at the most important KPIs that will help you create strategies to provide superior customer service and boost retention. What are customer serviceKPIs?
Customer journey KPIs, alongside product analytics , help product teams understand if they’re meeting their goals. This insight can help you make informed decisions to optimize your user experience. How to choose the right customer journey KPIs? You can use the collected data to offer help where it is needed.
Using KPIs and collecting the relevant data helps you balance intuition with empirical evidence. A Goal-directed Approach to Choosing KPIs. But the second part, acquire an initial user base , would require the introduction of a new KPI in order to understand if the acquisition goal has been met. Think of driving a car.
A music streaming service needs different health indicators than an aircraft manufacturer or online ad marketplace or security software vendor or dating app. It’s important to find KPIs that will provide insight into your business and help uncover underlying issues. And I entirely reject gross revenue as a company-wide KPI.
Set SMART goals and KPIs for your team to keep track of their progress and drive the product development process. Define your positioning and messaging to get a clear idea of how you’ll promote your product once it’s ready for your target market. Analyze in-app user satisfaction using tools like NPS and CSAT surveys.
Your mind runs through your dashboard. In practice companies struggle with settling for just one top KPI, and with good reason. North Star Metric, One Metric, top business KPI?—?are The more value you capture the more money, data and other resources you have to invest in delivering yet more value to the market.
A potent tool, ChatGPT has proven to be a strategic addition to the product management toolkit, churning out ideas in even the most unlikely scenarios. TL;DR The machine learning-powered ChatGPT can help product managers generate ideas, conduct market and user research , analyze data (app store reviews, user feedback, etc.),
Meanwhile, smaller companies need more tactical support around managing data, tools, and communications. Where does the product operations domain intersect with data? A strong product operations worker must know the product well, which demands deep curiosity and insight. Getting familiar with data is key to success.
What are the best tools for user activation and feature adoption? Which tools do you guys use for user retention? What tools should I use to boost my feature engagement? so we thought – let’s collect the most helpful tools for each stage of the marketing funnels and user journey. Product Growth Tools: Activation.
Are you tracking the right Product Marketing KPIs? With so many product growth insights available to every product marketer, it’s sometimes hard to understand which metrics are relevant and which you should be tracking to measure the success of your product marketing. What is a Product Marketing KPI metric?
And on a broader level, how do you see the Dribbble community shaping the tool that you’re building, and vice versa, how does the tool shape the community itself? Ultimately we have an amazing community team that manages our social and support channels, and reports feedback, bugs and other issues back the product team.
Whether you’re hiring, job hunting, or simply curious, we’ve got you covered with practical insights and ready-to-use resources. A marketing analyst job description outlines the key responsibilities, must-have skills, and qualifications needed to transform marketing efforts through data-driven insights.
In order to better understand users—their wants and their unique problems that need proactive solutions—it’s crucial to involve data in every step of the product-development process. JW: Product and growth shouldn’t be conceptualized as two separate service offerings. Tai Rattigan: What’s your role at Fueled?
While product growth may seem as simple as “attract customers to your Software-as-a-Service solution” there are countless SaaS challenges and customer issues that you’ll need to overcome along the way. As the number of software tools and subscriptions increase, so too do the expectations of SaaS customers.
In this comprehensive guide, we’ll break down underlying customer activation strategies and actionable strategies, specific onboarding tools , and techniques, and tangible examples to learn from. You can’t create an engaged, loyal customer without the right tool for the job. Data is power. What are you waiting for?
Userpilot is a versatile product growth platform that can help you collect the necessary data and build personalized in-app experiences code-free. Gain customer insights to develop customer-centric strategies. ” KPI vs. OKR. . – Implement minimum viable onboarding. What are customer success OKRs?
Ultimately, you’re always in a weaker position if you’ve not prepared the ground for what you hope to achieve. The Vision as a Tool. Justify Your Position. That could be about alignment, return on investment or cost of delay or whatever, but have some kind of reason backed up with data. Start with the end in mind.
OKRs are different from KPIs because a KPI is strictly a metric that reflects performance. Userpilot can help marketing teams with OKRs with our product usage analytics and in-app goal tracking. There are two main performance frameworks in product marketing – OKRs and KPIs. Different types of product marketing OKRs.
Use data to identify the biggest problems in your product. By analysing data you can identify where the biggest problems lie in your product and focus on solving these. You’d be surprised how easy it can be to get suspicious numbers, often due to errors in data collection rather than errors in calculation. Use charts.
We organize all of the trending information in your field so you don't have to. Join 96,000+ users and stay up to date on the latest articles your peers are reading.
You know about us, now we want to get to know you!
Let's personalize your content
Let's get even more personalized
We recognize your account from another site in our network, please click 'Send Email' below to continue with verifying your account and setting a password.


Let's personalize your content