This site uses cookies to improve your experience. To help us insure we adhere to various privacy regulations, please select your country/region of residence. If you do not select a country, we will assume you are from the United States. Select your Cookie Settings or view our Privacy Policy and Terms of Use.
Cookie Settings
Cookies and similar technologies are used on this website for proper function of the website, for tracking performance analytics and for marketing purposes. We and some of our third-party providers may use cookie data for various purposes. Please review the cookie settings below and choose your preference.
Used for the proper function of the website
Used for monitoring website traffic and interactions
Cookie Settings
Cookies and similar technologies are used on this website for proper function of the website, for tracking performance analytics and for marketing purposes. We and some of our third-party providers may use cookie data for various purposes. Please review the cookie settings below and choose your preference.
Strictly Necessary: Used for the proper function of the website
Performance/Analytics: Used for monitoring website traffic and interactions
If you’re a financial services product manager, you’ll know that crafting an effective fintech app onboarding process is no small feat. There are challenges unique to financial services that become magnified when dealing with mobile devices. Your onboarding process needs to set the tone with your users so you can build trust.
When it comes to boosting your product growth, user tracking tools can make your life a lot easier. They offer insights into product performance , what your users are doing inside your product, and why they are doing it. But how do you know you’re picking the right tools? Pendo is the best for tracking mobile users.
As companies usually have many different KPIs, maintaining or growing customer retention is a key KPI that each business commonly shares. You might also be interested in Mobile app KPI dashboard examples and how to use them What is customer retention and why is it so important? How do I measure my retention rate?
As the CEO of Dribbble, a global community and invite-only platform for designers to share and find work, Zack Onisko faces a unique challenge: how do you grow a gated product? Over time it’s become more of a mixed platform. Growing a gated platform. What drove that change? Dribbble hasn’t done that.
Having trouble deciding which customer serviceKPI to use? There are some vanity metrics among the KPIs for customer service. So let’s look at the most important KPIs that will help you create strategies to provide superior customer service and boost retention. What are customer serviceKPIs?
Which product analytics tools should you be using? How many analytics tools do you need? Some analytic tools are confusing, some are difficult to use, and some are downright irritating, making it hard to access the product growth insights you need. What are product analytics tools? Let's get started… TL;DR.
UX KPIs, or userexperience key performance indicators, are essential numerical data points that are used to track, measure, and compare the experienceusers have with your SaaS product. Userexperience (UX) involves all aspects of user interactions with your product.
A market segmentation survey is a market research tool. Usage-based segmentation segments users by the frequency and intensity of product usage. Userpilot is a product growth platform with advanced segmentation features. How does your location influence your technology and software choices?
Product managers are aware of the basic KPI metrics to measure for their mobile app, but there are a handful of underestimated KPI metrics that product managers need to measure as well. An important KPI metric to focus on here is the average time between each consecutive step.
Looking to build better userexperiences? It’s time to stop passively observing your analytics and start engaging your users. Here is why user engagement is the new key to build innovative experiences. It all starts with user feedback. And it doesn’t involve tracking every action your users do.
In this guide, we’ll go over how you can use product analytics to conduct a customer satisfaction analysis in 6 steps, as well as provide tools and tips to do so. TL;DR Customer satisfaction analytics refers to the process of collecting, analyzing, and interpreting data to evaluate how satisfied customers are with a product or service.
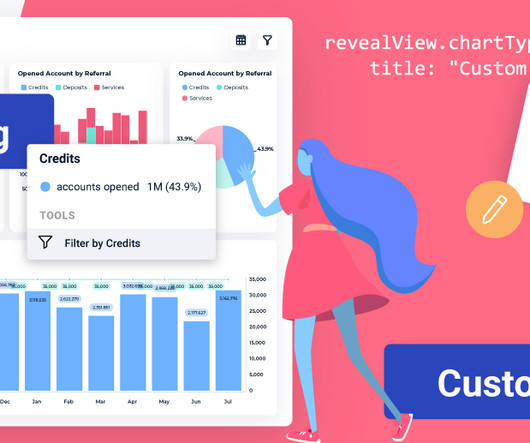
DIY Custom Visualizations with Reveal With this innovative addition to our platform, you can now control the chart types available within your dashboards. Tailor the experience for your users by removing any of our default chart types that may not be relevant to your specific needs. Bug Fixes All Platforms Reveal 1.6.0
Analyze in-app user satisfaction using tools like NPS and CSAT surveys. Improve your product based on qualitative and quantitative data on user behavior and sentiment. Userpilot’s product analytics reports can help implement and improve your product strategy framework. Q3 : Add advanced analytics and reporting features.
The reason for this trend is because late discovery of extreme application latency typically leads to brand compromises on userexperience in favor of time to market and/or the release may be delayed allowing an extended code undoing, a very expensive task for developers, and one teams are looking for eliminate.
Best way to track and measure product management KPIs. Product management KPIs help product teams outline and track the business or product success. KPI stands for Key Performance Indicator, and OKR stands for Objectives and Key Results. What are product management KPIs? What’s the difference between KPIs and OKRs?
Userpilot is a versatile product growth platform that can help you collect the necessary data and build personalized in-app experiences code-free. The main difference is that customer success OKRs set the direction for CS strategies, while CS KPIs measure progress against customer success OKRs. ” KPI vs. OKR.
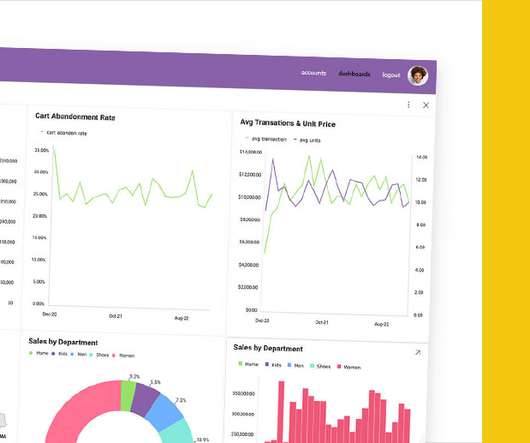
Choosing the right embedded analytics solution to partner with is crucial. Nowadays, it is quite evident that businesses’ success heavily relies on data insights that embedded analytics software can provide them with. Alternative embedded analytics solutions Features comparison. Reveal Embedded Analytics.
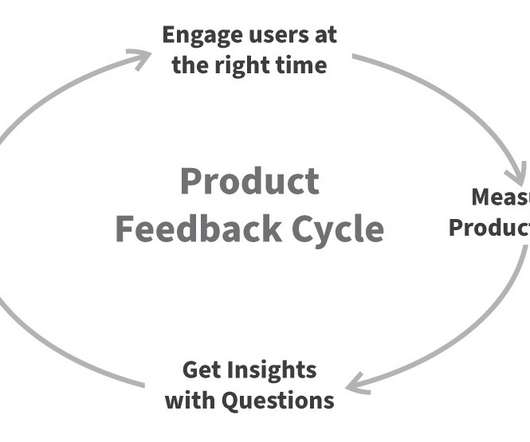
Customer feedback surveys serve as invaluable tools for gathering actionable insights directly from your audience. However, it’s important to know when and how to trigger the forms to gather user feedback , for increased response rate and data credibility. Track overall satisfaction with your product or service. Product usage.
In SaaS, a new user activation dashboard can become a massive product analytics tool to understand and optimize the user journey. But how can a dashboard for user activation can help you engage more users? moment ," impacting user retention and satisfaction. What is a new user activation dashboard?
That said, let’s explore the most critical product marketing metrics to track, along with the latest benchmarks in 2024: Check out the 2024 Benchmark Report. These metrics can highlight opportunities for improvement that lead to a more polished userexperience. User activation rate formula. NPS Benchmarks 2024.
From analyzing market trends to churning user needs and technical feasibility into golden product ideas, there are many benefits of ChatGPT for product managers. A potent tool, ChatGPT has proven to be a strategic addition to the product management toolkit, churning out ideas in even the most unlikely scenarios.
As we indicated in our previous blog, AIOps (Artificial Intelligence for IT Operations) refers to the application of machine learning analytics technology that enhance IT operations analytics. Proactively learn about issues that may affect service delivery down the line. 6 Metric aggregation and service quality indicators.
Determine the right analysis report to use. Determine the right analysis report to use Once you have selected the metrics to analyze, you need to determine the analysis report to employ. Userpilot offers Trends, Funnels, and Retention analysis reports, depending on your goal. Funnel analysis report.
As the Director of UserExperience, our team was tightly partnered with our product management counterparts to ensure we had baked-in practices and habits that enabled all of our development teams to deliver an exceptional product experience effortlessly. What is Customer Experience (CX), and Why Does it Matter?
Lead Product Analyst : A lead product manager leads the product analysis efforts and monitors the research, analysis, reporting , and strategy development. Best tools for product analysts Best tool for Product Analysis ( Userpilot ) : Userpilot gives you insight into your product performance and helps you understand user behavior.
During a recent webinar covering the survey ( now available on demand ), Kuldeep Kelkar offered his take on this data, and advised on how experience professionals can not only overcome the top challenges reported by their peers but also how to stay ahead of the emerging enterprise UX trends. But budgets are not matching this growth.
NPS (Net Promoter Score) measures users’ likelihood of recommending your product to others. CSAT ( Customer Satisfaction Score ) measures customers’ satisfaction with your product or service. Customer churn rate measures the percentage of customers who stop using your product or service during a specific period.
Mixpanel is a best-in-class telemetry tool for product analytics. This means Mixpanel doesn’t add any new functionality to your product; it simply makes it possible (and easy) to measure how users interact with any application by collecting discrete user behaviors as data, and storing that data securely in the cloud.
It’s been just over a year since Moritz joined NBC, and we spoke to him about his process of redesigning the storied news organization’s digital properties from the outside in, why audience loyalty is his number one KPI and how he’s improving the monetization efforts of sites like msnbc.com and today.com. Here’s our interview with Moritz.
UserExperience is a key factor regarding the success of a digital product, and the main ingredient to an excellent UX lies in a thorough user-centered approach. In other words, it is crucial to a product's success to consider who the users are, as well as their motivations and goals. Table of contents.
The reason for this trend is because late discovery of extreme application latency typically leads to brand compromises on userexperience in favor of time to market and/or the release may be delayed allowing an extended code undoing, a very expensive task for developers, and one teams are looking for eliminate.
Therefore, it is essential that your website reflects the image of your brand and provides visitors with a positive and informative userexperience. You can also take advantage of Google’s free website health check to get a more in-depth report on your site’s health, broken links, and more. What is a UX Audit? Evaluation.
Mixpanel is a best-in-class telemetry tool for product analytics. This means Mixpanel doesn’t add any new functionality to your product; it simply makes it possible (and easy) to measure how users interact with any application by collecting discrete user behaviors as data, and storing that data securely in the cloud.
Running experiments adds a structured approach to discovering unbiased learnings and uncovering the real cause to changes in metrics, even when they are too small to be measured independently. Why do you need to run Experiments? ? You become less likely to get derailed by changes in metrics that are not primary to the experiment.
Ten of the most important SaaS KPIs are the Customer Acquisition Cost, Customer Lifetime Value , Lead Velocity Rate , Trial-to-Paid Conversion Rate , Monthly Recurring Revenue, Customer Churn Rate , Annualized Contract Value , Expansion Revenue MRR , Net Promoter Score , and the SaaS Quick Ratio. Qualitative KPIs. Leading KPIs.
Here are the most important KPIs for the performance of your product: Net Promoter Score (NPS). Your Net Promoter Score (NPS) will show you how likely your users are to recommend your product or services to others. For product managers, it’s a way to keep your finger on the pulse of users. Active Users Per Total Users.
Even more importantly, you might miss the chance to achieve what your PLG strategy was designed for—enhanced userexperiences, product adoption, and overall business growth. . Moreover, product-led growth focuses all your efforts on improving your users’ experiences. User Behavior. Advanced Reporting.
By knowing the behavior of your current users, you get the insights that help you create the right products, and influence more future users. You will be easily able to determine the roadblocks your users run into that keeps them from converting or coming back for your service. Usability Testing.
Enter mobile app analytics software that unlocks insights and empowers smarter decisions. What is mobile analytics software, and why do you need it? Mobile analytics software is a suite of tools designed to help you track, measure, and understand how your mobile app performs and how users interact with it.
There are many ways to approach this, but my favorite is how Duolingo created a Markov model around their main business KPI (DAUs) to grow it. In the same way, you can start from your business KPI and then break it down into sensitive metrics you can act on. Looking for a Platform to Help You with Root Cause Analysis?
So, if you occasionally get the User Journey mixed up with the UserExperience … Or if you confuse Flywheels and Flows from time to time… Or even if you can’t tell your JTBDs from your TTFV and your AARRR … Then welcome to the Userpilot Product Adoption Dictionary! Adjacent Users. Activation.
In this article you’ll learn: What monthly active users (MAUs) are and why you should care. 6 ways to turn passive customers into engaged users. The best user engagement tools to use to turn new users into active users. Measure MAUs by accounting for depth of usage and different user segments.
And as a product manager finding out how others made a strategy work, whether it was implementing a road-map software or avoiding other’s pitfalls can make or break your product’s success. Magazine reports that most CEOs read at least a book a week, and this doesn’t include blogs, articles, podcasts, and videos they devour, too.
This is why a lot of companies are investing in User Research. It’s no wonder, then, that the number of research studies on the UserZoom platform are doubling every eighteen months (new Moore’s Law). You can read more at Top UX Measurements and KPI as well as listen to our webinar on Universal Measures. Conclusion.
We organize all of the trending information in your field so you don't have to. Join 96,000+ users and stay up to date on the latest articles your peers are reading.
You know about us, now we want to get to know you!
Let's personalize your content
Let's get even more personalized
We recognize your account from another site in our network, please click 'Send Email' below to continue with verifying your account and setting a password.


Let's personalize your content