This site uses cookies to improve your experience. To help us insure we adhere to various privacy regulations, please select your country/region of residence. If you do not select a country, we will assume you are from the United States. Select your Cookie Settings or view our Privacy Policy and Terms of Use.
Cookie Settings
Cookies and similar technologies are used on this website for proper function of the website, for tracking performance analytics and for marketing purposes. We and some of our third-party providers may use cookie data for various purposes. Please review the cookie settings below and choose your preference.
Used for the proper function of the website
Used for monitoring website traffic and interactions
Cookie Settings
Cookies and similar technologies are used on this website for proper function of the website, for tracking performance analytics and for marketing purposes. We and some of our third-party providers may use cookie data for various purposes. Please review the cookie settings below and choose your preference.
Strictly Necessary: Used for the proper function of the website
Performance/Analytics: Used for monitoring website traffic and interactions
This is the first of two posts that deep dive on A/B testing, expanding on a talk I gave at Google Playtime 2016 in London. In this post I share some of the learnings we’ve had after running 60+ A/B tests at Peak , looking at each step of the A/B testing cycle in turn. Brainstorm your A/B tests. Prioritise your A/B tests.
Userexperience is the concept of gauging the satisfaction or frustration of your users while they interact with your product/service. Optimizing the user’sexperience throughout their journey is one of the best ways to improve your brand image and secure lasting engagement.
With no-code user onboarding tools , it’s easy to start building onboarding journeys that don’t reflect reality—all in a vain attempt to get new users to activate faster so they don’t churn. Userexperience journey mapping makes us ask this question: How do users move through their own goals, not our hoops?
” Here he talks about the ideas of A/B testing and reverse A/B testing. 3) Embed the Mission and KPI Within the Teams. Focus is essential in order to deliver value to users and to capture value for the organization. Aligned to the corporate objectives, the metrics of measurement should be actionable.
Introduction Are you used to getting a certain amount of data from your testing practices? Did you know that today you can extract more data from your existing testing practice…with zero additional effort. Some of these include team structure, outdated perception of performance tests or the tools that are being used.
Every product has features that are designed around the core of a company’s product/market fit (PMF), while other features can be used to test new growth initiatives, new lines of revenue, or to optimize the customer experience. think about how to drive users back to the app via notifications, emails, or SMS.
A crew’s happiness is directly related to the quality of their outputs and so is measured as any other KPI would be. As with many other speakers at MTPCon17, Jane’s colleagues at Moo follow a journey that sees them diverge to help discover the issue they face and then converge around a solution that they can test and repeat.
Or that an OKR is the same as a KPI. UX (UserExperience) and UI (User Interface) design are, in the grand scope of tech roles, somewhat similar. UX, or UserExperience design, was first laid out by Don Norman in his 1988 book The Design of Everyday Things. What Does Good Design Look Like?
Customer journey KPIs, alongside product analytics , help product teams understand if they’re meeting their goals. This insight can help you make informed decisions to optimize your userexperience. Consider both leading (future-oriented) and lagging (past outcome-based) indicators for the KPIs.
UX KPIs, or userexperience key performance indicators, are essential numerical data points that are used to track, measure, and compare the experienceusers have with your SaaS product. Userexperience (UX) involves all aspects of user interactions with your product.
With that said, we still spend a lot of time talking to the Dribbble Community and asking them about their experience, the platform and how we can ultimately improve. One of the investments we’re making is carving out a proper userexperience research function in our internal design team.
Validating one with the other gives you the whole picture and confidence to make decisions that improve usersexperience. Use these methods to collect qualitative data: In-app surveys : A tool like Userpilot lets you trigger surveys in your mobile app based on user behaviour and collect contextual feedback with logic conditioning.
Introduction Are you used to getting a certain amount of data from your testing practices? Did you know that today you can extract more data from your existing testing practice…with zero additional effort. Some of these include team structure, outdated perception of performance tests or the tools that are being used.
Strategic differentiation could be better data that you have access to, a simpler userexperience, more sophisticated functionality, a cost advantage, or so many other elements of differentiate too numerous to list. Monetization Strategy. Equally important is understanding how you generate revenue from your product or service.
A key result is not the same thing as a KPI (key performance indicator). A KPI is used to measure the continued progress towards a defined performance measure. Improve UserExperience. Increase new user base by 10% end of Q2 2021 Expand usage of existing accounts by 5%. Key Results. Increase Membership Numbers.
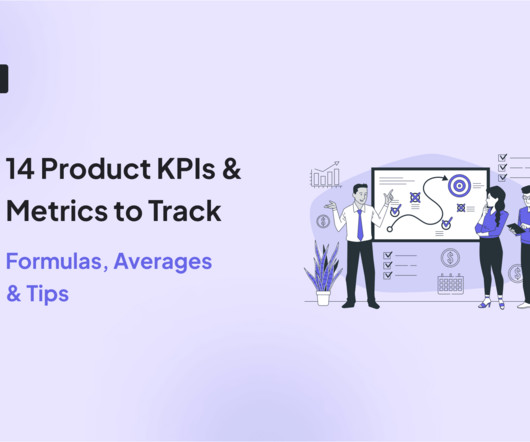
Best way to track and measure product management KPIs. Product management KPIs help product teams outline and track the business or product success. KPI stands for Key Performance Indicator, and OKR stands for Objectives and Key Results. What’s the difference between KPIs and OKRs? Let’s get started!
By understanding the psychology of play, creativity, and learning, youll craft experiences that are seamless, rewarding, and deeply immersive. A seasoned product leader with over 5 years of experience in product or program management, product marketing, business development, or technology. Who would be the best fit for this job?
Dark periods are when a product team knows what to design and develop and go about doing it, but the work has yet to be exposed to users in any significant way. Product dark periods are when a product team’s commitment and culture are tested. Product dark periods test our skills, our determination, and our professionalism.
Of course, a team is successful only when they collaborate as “one team,” so expect to roll up your sleeves for designing the solution, testing it, providing early feedback, documentation, etc. Long term, you can expect to manage a specific KPI (e.g., improve first userexperience, reduce churn, etc.),
OKRs are different from KPIs because a KPI is strictly a metric that reflects performance. There are two main performance frameworks in product marketing – OKRs and KPIs. Meanwhile, a KPI is a single metric that gives a reflection of performance in one area. Grow Monthly Active Users (MAU) by 12%.
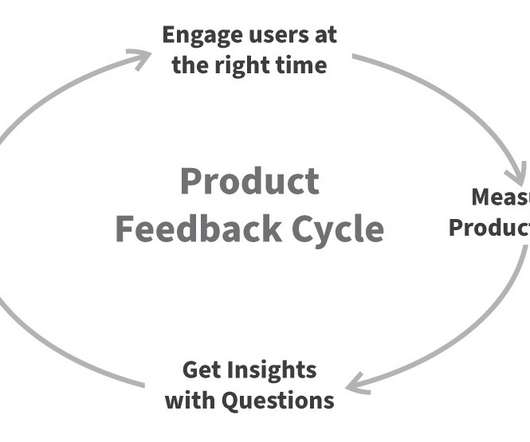
Looking to build better userexperiences? It’s time to stop passively observing your analytics and start engaging your users. Here is why user engagement is the new key to build innovative experiences. It all starts with user feedback. And it doesn’t involve tracking every action your users do.
Experimentation and A/B testing are bread and butter in marketing, but in product…it gets complicated. And in companies where dev resources are scarce, product experiments are often dropped altogether. Why Product Managers Need Product Experiments. Goal Setting For Product Experiments. Source: userpilot.com.
Retention is a metric that measures how many users return to your product over a period of time and considered to be one of the most important KPIs when trying to analyze the product health or potential, it is a key indicator for growth and impacts almost every key business metric (e.g. DAU, Stickiness, LTV and more).
The Ultimate Guide to Experimentation for Product Teams Why run Experiments? What is a Minimum Viable Test? How to define success in experiments? Why do you need to run Experiments? ? What is a Minimum Viable Test? On average, less than a quarter of experiments are successful.
We tested whether and how different pricing models—monthly/annual subscription, voucher codes, free trial periods, refer-a-friend—affect conversion. We’re able to make cohorts out of those users, and to see whether a user entering through a voucher code is a better or worse converter, two months from now, three months from now, etc.
We tested whether and how different pricing models—monthly/annual subscription, voucher codes, free trial periods, refer-a-friend—affect conversion. We’re able to make cohorts out of those users, and to see whether a user entering through a voucher code is a better or worse converter, two months from now, three months from now, etc.
The major benefit of working in Agile is that you can get a working product or feature in front of users in a very short amount of time. The problem is that within a two week Sprint, user research isn’t done because Agile adopters don’t think they can get users into a two-week sprint fast enough to do the tests.
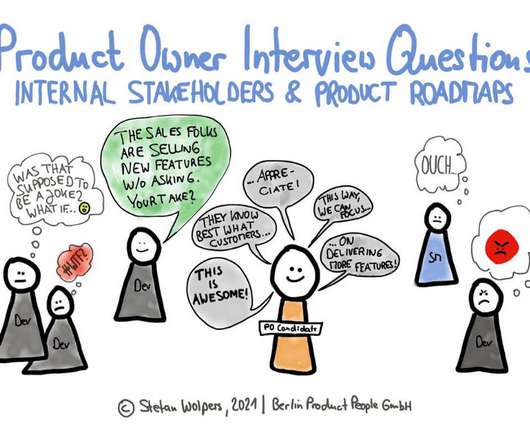
Team up with the userexperience people and run, for example, user journey or user story mapping workshops. Or invite stakeholders to Product Backlog refinement sessions to explain a user story’s value to the rest of the Scrum Team. (For for example, ROI, cost savings, engagement, and other KPI?—?have
Guide users to activation events with onboarding flows. Well-designed onboarding flows can lead users to essential actions. For example, The Room increased new user activation by 75% by optimizing its onboarding process. A/B test different onboarding flows. Collect user feedback to understand friction points.
A product strategy framework gives you a way to test, adjust, and develop your product strategy. These include product vision and mission, user needs analysis , goals and KPIs, pricing strategy, product roadmap, and more. It ensures that you provide a consistent userexperience across all channels.
As this Venn diagram shows, being “data-informed” means you operate at the intersection of pure data, your own gut feeling — which is a pretty powerful and educated tool you have as a product person — and everything else, including design thinking, qualitative data, user research, and userexperience tools and workshops.
For instance, a SaaS provider of e-commerce platforms might customize its offerings by integrating specific payment gateways popular in certain regions, like PayPal in the US or Alipay in China, to improve userexperience and increase sales. This segmentation helps you understand how different users interact with your product.
PMMs use product analytics to gain actionable insights into their customers' experiences, understand what's driving success and what's causing friction in the user journey to help the customer achieve repeated value by using the product. A/B testing in-app experiments to improve engagemen t. Data funnels.
For a free, in-depth guide to running user research in Agile Sprints, check out our comprehensive e-book: Download “How to Run Research in Agile” 2) Sourcing the right participants. Recruiting participants is always one of the most persistent pain points in conducting user research and usability testing.
The main difference is that customer success OKRs set the direction for CS strategies, while CS KPIs measure progress against customer success OKRs. Thus, an OKR could be “launch customer engagement initiatives,” and the relevant KPI could be “10%+ growth of engaged customer views per month.”
Expansion MRR is the main KPI to track revenue growth you gain from current customers through upsells, add-ons, and cross-sells. Good Upselling Examples we cover: Slack uses well-timed in-app messaging to turn free users into paying customers. Figma’s Figjam tests placement and message types when free trials are about to expire.
Great userexperience matters for digital experiences across all industries yet many websites catering to the health insurance market fall short. Our quantitative study had a sample size of 200 for the screen recording behavioural test, while the qualitative study with a sample size of 20 for a think-out-loud test.
However, we all have had a love-hate relationship with certain apps at some point in time, sometimes making us falling short of converting into a paid user. Looking from a product manager’s perspective, the most critical KPI for any app is its conversions.
This practice includes both A/B testing and website personalization: every website presents a unique set of features and designs, which must, in turn, be optimized through A/B testing. Even within a single industry, users will hold varied expectations based on your brand, communication style, target audience, funnel, etc.
As many as 80% of your users will skip your product tour if it consists of more than 5 steps! The more personalized the userexperience, the more your customer feels special – like you care about their individual needs. But all users need to know how to create boards and tasks. They lack personalization. Kontentino.
You will learn to: Understand how frequently users are returning to your site or product. Optimize your customer journey by analyzing A/B test results. Flag issues in your customer journey to quickly mitigate negative effects. Measure the impact of a specific step in your customer journey. Master Dashboard tips and tricks.
It’s been just over a year since Moritz joined NBC, and we spoke to him about his process of redesigning the storied news organization’s digital properties from the outside in, why audience loyalty is his number one KPI and how he’s improving the monetization efforts of sites like msnbc.com and today.com. Here’s our interview with Moritz.
Sign-up-to-customer rate – the rate of the users who have turned from free trials to the paid versions. Another solid KPI is to track the success of how many users actually use the product and get to the activation point. Users who experience the value of the product firsthand are more likely to convert to paying users.
Mixpanel’s reports and modules make it possible (and easy) to answer difficult questions about your end users’ behaviors in your product. And ultimately, that analysis will give you hard facts you can use to improve your userexperience.
We organize all of the trending information in your field so you don't have to. Join 96,000+ users and stay up to date on the latest articles your peers are reading.
You know about us, now we want to get to know you!
Let's personalize your content
Let's get even more personalized
We recognize your account from another site in our network, please click 'Send Email' below to continue with verifying your account and setting a password.


Let's personalize your content