This site uses cookies to improve your experience. To help us insure we adhere to various privacy regulations, please select your country/region of residence. If you do not select a country, we will assume you are from the United States. Select your Cookie Settings or view our Privacy Policy and Terms of Use.
Cookie Settings
Cookies and similar technologies are used on this website for proper function of the website, for tracking performance analytics and for marketing purposes. We and some of our third-party providers may use cookie data for various purposes. Please review the cookie settings below and choose your preference.
Used for the proper function of the website
Used for monitoring website traffic and interactions
Cookie Settings
Cookies and similar technologies are used on this website for proper function of the website, for tracking performance analytics and for marketing purposes. We and some of our third-party providers may use cookie data for various purposes. Please review the cookie settings below and choose your preference.
Strictly Necessary: Used for the proper function of the website
Performance/Analytics: Used for monitoring website traffic and interactions
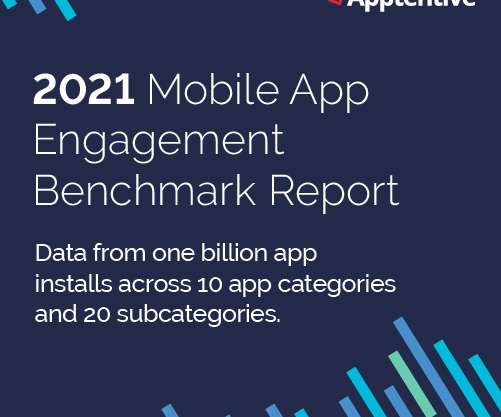
Today, we’re thrilled to release our 2021 Mobile App Engagement Benchmark Report. Apptentive’s annual mobile app engagement benchmark report serves as a baseline to help you understand your app’s engagement strengths and areas for improvement. Brands shifted focus to improving long-term retention.
I’m going to take a wild guess and assume that you already understand the importance of mobile in-app feedback tools. You also might be reading this post thinking: “Who’s adding new tools to their tech stack right now?” Do you have the right tools to capture that voice? Mobile in-app feedback tools & solutions.
Quick transitions to remote learning, usage and integration hurdles, lack of funding for new tech, and massive fluctuations in MAU all played a role in delivering a challenging year for educators and education technology across the country. 2021 Engagement Benchmarks for Education Apps. Working in Mobile Education in 2021.
The following data and information on Business Services apps is from our 2022 Mobile App Customer Engagement Report. Brands in Business Services had varied experiences in 2021. Brands working in monitoring and security faced hurdles more in-line with regular marketplace patterns. Download your copy here.
Speaker: Bhavana Angadi, Senior Product Manager at Hopscotch (Demand & Growth) | Former Product Manager at Bigbasket
According to Microsoft's Global State of Customer Service 2019 report, “90% of respondents indicated that customer service is important to their choice of and loyalty to a brand.” How to build effective Self-Service mechanisms. December 7, 2021 at 9:30 am PDT, 12:30 pm EDT, 5:30 pm GMT.
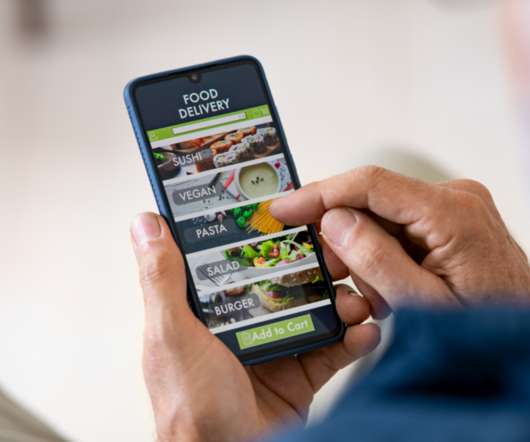
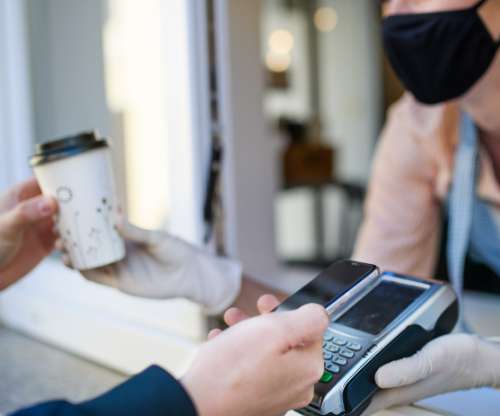
Subcategories: Restaurant, Food Services. In our 2022 Mobile Customer Engagement Benchmark Report , a study of more than 1,000 apps across a billion mobile app installs, we take a close look at apps in the Food and Drink category. Download the full 2022 Benchmark Report here. stars and Food Services apps averaging 4.59
Brands in the Business Services category faced diverse 2020 challenges. Brands focused on shipping faced challenges with cadences parallel to the impacts on local and national supply chains. Others (like brands in security and monitoring) faced few new challenges outside of their regular business patterns.
percent increase from 2021. With customers spending more time and money on mobile apps, it is important that companies continue to adapt and prioritize mobile in their customer feedback solution. What is a customer feedback solution? Below we identify five steps to create a holistic mobile customer feedback solution.
The following data and information on Shopping apps is from our 2022 Mobile App Customer Engagement Report. Subcategories for Personal Services Apps: Home and Family. DOWNLOAD THE FULL 2022 BENCHMARK REPORT HERE. Summary of Personal Services Apps in 2021. Home apps: Mobile customer engagement benchmarks.
issues with supply chains, global price drops, and budget constraints impacted each brand differently. In our 2021 Mobile App Engagement Benchmark Report , a study of 1,000 apps across a billion+ app installs, we take a close look at apps in the Utilities category. 2021 Engagement Benchmarks for Utilities Apps.
If 2020 was the shift to mobile, 2021 was the year we saw it reflected in the numbers. This report contains data from the following app categories: Finance. Personal Services. Business Services. The post Introducing: 2022 Mobile Customer Engagement Benchmark Report appeared first on Apptentive. Food and Drink.
In our 2021 Mobile App Engagement Benchmark Report , a study of 1,000 apps across a billion+ app installs, we take a close look at apps in the Media and Entertainment category. Technology (media creation, connectivity, etc.). 2021 Engagement Benchmarks for Media Apps. Technology Apps. Games Apps. Sports Apps.
Recent marketplace fluctuations required brands to get creative in their app mobile engagement strategies. App retention can also be used as a trust signal around how well your brand knows its customers. As you act on your 2021 app retention strategy, here are the app retention benchmarks to aim for. App Retention in 2021.
One size did not fit all for Personal Services apps in 2020. Depending on industry, issues with supply chains, global price drops, and budget constraints impacted each brand differently. Personal Services apps are separated into two subcategories: Home (real estate, property management, connected devices, etc.)
The following data on mobile surveys and interaction and response rates is from our 2022 Mobile App Customer Engagement Report. In response, consumers interacted more with brands through their apps. In 2021, there was correlation between interaction rates and retention rates. Mobile interaction and response rate benchmarks.
The following data and information on Media apps is from our 2022 Mobile App Customer Engagement Report. Subcategories for Media Apps: News, Telco, Technology, Games, Sports, Music. DOWNLOAD THE FULL 2022 BENCHMARK REPORT HERE. Summary of Media Apps in 2021. Technology (media creation, connectivity, etc.).
In our 2021 Mobile App Engagement Benchmark Report , a study of 1,000 apps across a billion+ app installs, we take a close look at apps in the Food and Drink category. Read on for data-supported research and benchmarks Food and Drink apps should focus on in 2021 and beyond based on what was learned from a year like no other.
The following data and information on Travel apps is from our 2022 Mobile App Customer Engagement Report. In 2021, Travel began its road to recovery following interstate, national, and global travel restrictions brought on by the pandemic. DOWNLOAD THE FULL 2022 BENCHMARK REPORT HERE. Summary of Travel Apps in 2021.
Let’s discover the evolution of e-commerce technology. Even businesses that never sell products through technology have faced the dilemma of either selling an online or closing business. The advent of advanced e-commerce technologies has transformed the e-commerce industry and built a strong foundation for online retailers.
In our 2022 Mobile Customer Engagement Benchmark Report , a study of more than 1,000 apps across a billion mobile app installs, we take a close look at apps in the Healthcare category. Healthcare apps are divided into three subcategories: Medical (public health, condition management, reproductive services, etc.) and Health Insurance.
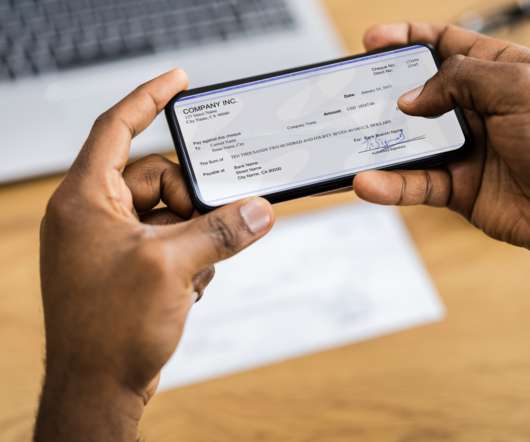
The following data and information is from our 2022 Mobile App Customer Engagement Report. Below is a summary of how Finance app fared over the course of 2021. DOWNLOAD THE FULL 2022 BENCHMARK REPORT HERE. Summary of Finance Apps in 2021. Mobile teams prioritized proactively communicating with their consumers in 2021.
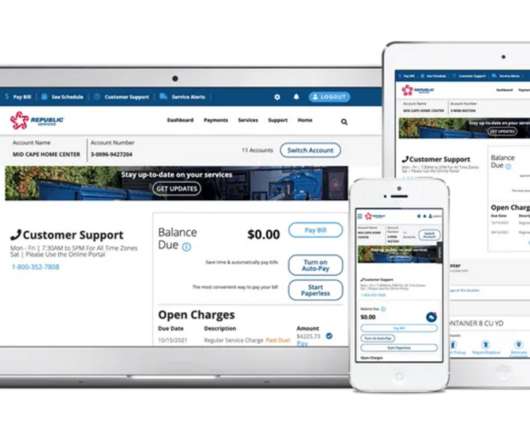
The following data and information on Utilities apps is from our 2022 Mobile App Customer Engagement Report. Brands in the Utilities industry faced various hurdles throughout 2021. Below is a short summary of how Utilities apps fared in 2021. DOWNLOAD THE FULL 2022 BENCHMARK REPORT HERE. Shifted emotions.
While we watched brave, brilliant healthcare workers combat the pandemic on the front lines, the mobile technology used to support their efforts from home underwent massive change. In our research, Healthcare apps are divided into two subcategories: Medical (public health, condition management, reproductive services, insurance, etc.)
It has also changed how we interact with our favorite stores, restaurants, and service providers – even our healthcare providers. While these technologies have become the norm, they weren’t always this way. As our technology has changed over the last year, so have our behaviors. Personalization.
Finance brands were generally spared by the marketplace shakeup of 2020. In our 2021 Mobile App Engagement Benchmark Report , a study of 1,000 apps across a billion+ app installs, we take a close look at apps in the Finance category. 2021 Engagement Benchmarks for Finance Apps. Working in Mobile Finance in 2021.
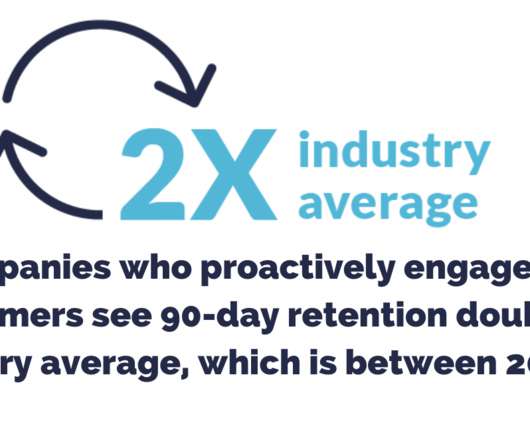
Apptentive’s annual Mobile App Engagement Report serves as a baseline to help app publishers across categories understand their app’s engagement strengths and areas for improvement. Brands shifted focus to improving long-term retention. 63% of consumers who were proactively engaged in Q1 were still seen later in the year (Q3-Q4).
In our 2021 Mobile App Engagement Benchmark Report , a study of 1,000 apps across a billion+ app installs, we take a close look at apps in the Food and Drink category. Read on for data-supported research and benchmarks Retail and eCommerce apps should focus on in 2021 and beyond based on what was learned from a year like no other.
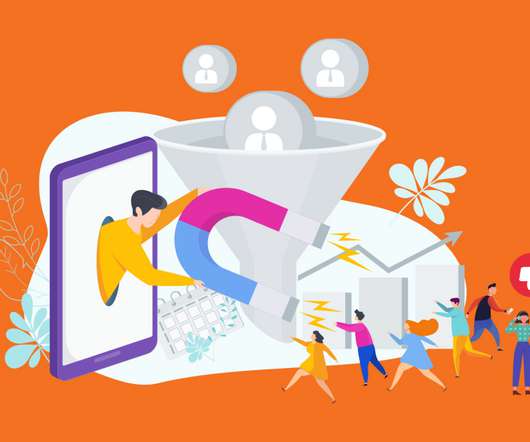
An app referral program is essentially a tool that makes it easy for your existing customers to share your brand with friends directly from the app experience. And you don’t need to be in the services industry for in-app referrals to work with your strategy. Related: Apptentive’s 2021 Mobile Engagement Benchmark Report.
According to one Microsoft Global State of Customer Servicereport , 90% of consumers surveyed said that customer service is an important factor in their choice of, and loyalty to, a brand, while nearly two-thirds (58%) would sever their relationship with a business due to poor customer service.
When we were writing this post, we did a little research to see what other brands were saying about mobile customer experience. Typically, when brands claim this, it’s more of a marketing technique and less of an actual pillar in their product strategy. So, we won’t waste your time. Love Dialog. Rating prompts. Message centers.
Software-as-a-service (SaaS) models, which operate on a subscription basis and are centralized and situated on a remote cloud network, are increasingly popular with businesses for a variety of factors, including flexibility and affordability. Saas startups that provide software as a service have a good delivery model.
One of the most common surveys brands deploy is the NPS survey. We know NPS can be a powerful tool if used correctly, and recognize the value in having one metric to provide a holistic pulse on your customer experience. How easy was it to report issues you encounter? We simply ask, “Do you love [insert your brand here]?”
Our Holiday Shopping Experience Report, based on a survey of 1,000 U.S. consumers and 500 customer service workers, found that customer expectations are higher than ever – and these increased pressures have led more than half of stressed-out and under-resourced customer support reps to consider leaving their job.
The concept of retargeting mobile customers is not a new idea by any means, but few brands practice it successfully. Obviously, in order to start segmenting on demographic data, you’ll need a system and CRM to collect this information. This takes some basic research but tools like Statista can help you quickly gather high-level data.
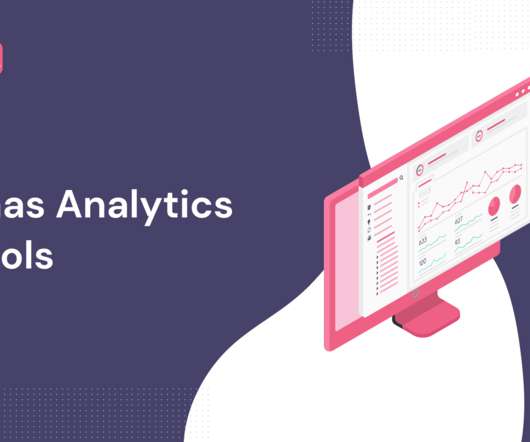
Data is the engine for SaaS, but without data analytics tools , your SaaS team will not be able to make sense of the data. The right set of SaaS analytics tools can help you generate actionable insights that fuel strategic decisions. But how do you ensure you’re picking the right tools?
Data from 2022 Mobile Customer Engagement Benchmark Report. A positive outcome of identifying your fans is identifying the people who are most likely to say great things about you and who’ve already raised their hand and said, “We love this brand.”. Fun fact: The number of surveys sent in 2021 increased by 12% year-over-year.
It began around 1931, starting with a memo from Neil McElroy at Procter & Gamble (P&G) about the need to hire people to own and understand P&G’s individual brands (products). Websites, apps, APIs and technologyplatforms often are the product for many organisations. Product management isn’t a new discipline.
When brands proactively solicit feedback from customers, they’re able to better identify pain points and eliminate friction faster. Product feedback helps brands: Better understand the customer journey. In-app surveys are an incredibly powerful tool for conducting mobile research and improving mobile product roadmaps.
The company has a feedback tool in place to gather feedback to identify and solve issues quickly. If a brand has a lower product adoption, this could be indicative of a myriad of issues from wrong market fit to a poor onboarding experience to product bugs and more. Effective onboarding helps make adoption seamless and fast.
We believe that innovation stems from truly understanding the problems that we are trying to solve instead of just implementing a solution,” says Mike. We believe that innovation stems from truly understanding the problems that we are trying to solve instead of just implementing a solution.
Serving as the primary tool for showcasing skills and experience, they have been the gateway to countless career opportunities. However, in todays rapidly evolving job market, where attention spans are shorter and technology drives decisions, traditional resumes are struggling to keepup.
With AI technology, marketers can identify microtrends and even predict trends, saving time and resources through automated digital marketing services. The marketing industry is not immune to this digital transformation, as prominent brands are beginning to take advantage of the opportunities it presents. billion U.S.
More than integrations and features and quarterly reports, back in August, Intercom turned 10. With that in mind, before we welcome the new year and all the good things to come, we’ve gathered our favorite insights and nuggets of wisdom from 2021 in a special wrap-up episode. And what a year it has been!
In June 2021, Google confirmed that it will no longer track individuals online via cookies. Brands struggle to offer seamless omni-channel experiences, with about half of business decision-makers saying their brands do not have the ability to carry context across channels. There’s no two ways about it.
We organize all of the trending information in your field so you don't have to. Join 96,000+ users and stay up to date on the latest articles your peers are reading.
You know about us, now we want to get to know you!
Let's personalize your content
Let's get even more personalized
We recognize your account from another site in our network, please click 'Send Email' below to continue with verifying your account and setting a password.


Let's personalize your content