This site uses cookies to improve your experience. To help us insure we adhere to various privacy regulations, please select your country/region of residence. If you do not select a country, we will assume you are from the United States. Select your Cookie Settings or view our Privacy Policy and Terms of Use.
Cookie Settings
Cookies and similar technologies are used on this website for proper function of the website, for tracking performance analytics and for marketing purposes. We and some of our third-party providers may use cookie data for various purposes. Please review the cookie settings below and choose your preference.
Used for the proper function of the website
Used for monitoring website traffic and interactions
Cookie Settings
Cookies and similar technologies are used on this website for proper function of the website, for tracking performance analytics and for marketing purposes. We and some of our third-party providers may use cookie data for various purposes. Please review the cookie settings below and choose your preference.
Strictly Necessary: Used for the proper function of the website
Performance/Analytics: Used for monitoring website traffic and interactions
The Value of Using a Jobs Dashboard to Drive Your Demo Most software sales demos follow the same formula a handful of slides telling buyers about your company followed by an overview of the product, and then you dive into the demo. The jobs dashboard is your way of serving the meal in easily digestible portions.
Alert fatigue is a common problem among engineering teams that handle operations and maintain infrastructure. The result is lots of semi-meaningful alerts, noise, context-switching, and multitasking for the on-call engineer. Are the steps clear enough to be followed by any engineer on the team? Is the alert still relevant?
Learn about the importance of mobile app KPI dashboards and copy dashboards from real mobile app product managers, engineers and designers. A key performance indicator (KPI) dashboard is a visual representation of data that quantifies how well a team is performing towards its goals.
Many engineers who make the transition to a management role face a bit of a conundrum – if I stop doing hands-on work, my team will lose a strong engineer and instead will gain an inexperienced manager. When I joined Intercom, my manager asked me if I wanted to onboard as an engineer or as a manager. When should you write code?
But today, dashboards and visualizations have become table stakes. Think your customers will pay more for data visualizations in your application? Five years ago they may have. Discover which features will differentiate your application and maximize the ROI of your embedded analytics. Brought to you by Logi Analytics.
Next, the analytics setup depends on engineers, which disrupts their workflow. Choose analytics tools that minimize engineering involvement When companies hear words like “data” and “analytics,” they immediately hand off that job to engineering teams. This causes siloed data and integration issues.
Custom dashboards to track key metrics at a glance. While your product managers use our analytics reports to track product usage, your engineering teams can use our session replays to uncover bugs, and your customer support team may use our in-app help center feature to offer self-service and reduce support tickets.
A dashboard showing metrics like feature adoption or user engagement amplifies your credibility. Tailor Your Communication: Adapt your messaging for different audiences, whether its engineering teams or senior leadership. Highlight Relevant Experience: Share examples of similar challenges youve tackled in the past to build confidence.
A typical workflow involved looking at a dashboard full of charts with metrics sliced and diced by various attribute combinations. That skill required constant practice – an unrealistic ask for the majority of product engineers who are busy delivering product. A typical operational dashboard we used before doubling down on traces.
increase isn't worth the engineering time we're spending! You'll learn: How to turn basic dashboard metrics into a financial model. Some teams struggle to constantly optimize conversion rates without understanding the financial impact of those conversion rates. Sometimes that 0.1% May 1, 2018 11:00 AM PST, 2:00 PM EST, 7:00 PM GMT
In the retail industry, customer feedback is your early warning system, your innovation engine, and your most honest performance review. Turn survey responses, review data, and post-purchase feedback into clear dashboards your teams can actually use. But this system only works if you take action on the feedback collected.
Plus, the ability to create custom NPS dashboards allow you to analyze the results easily without writing a line of code. Get real-time access to customer feedback via a centralized dashboard that updates as responses come in. Visualize detailed reports with advanced data segmentation and dashboards.
Data PM: organizations dealing in data products (building AI/ML based products) prefer a PM with data science background so that they can appreciate the problems well and being able to work with data engineers/scientists. The PRD is a PM’s primary communication tool with engineers. Hard Skills Required for the Role.
Problem Brief Over a span of 4 weeks, we tested Civians platform and created design solutions to improve the overall user experience of the dashboard. We also encouraged them to think out loud while they were navigating the dashboard, to help us uncover their mental model and identify hidden insights.
Based on your current dashboard, it looks like most users churn before completing onboarding. Now you must dig through support tickets, DM your engineer, and finally ask your data analyst to run a custom query. Start by creating a public dashboard that highlights shared metrics across teams. Which features need attention?
At most companies, software engineers are in a constant state of rushing to get features and bug fixes out the door. This means product analytics can be seen as a burdensome afterthought for a lot of engineers —one that just adds more grind to an already packed schedule. Allow engineering to lay a strong analytics foundation.
Google - The Anatomy of a Large-Scale Hypertextual Web Search Engine, written by Larry Page & Sergey Brin in 1998. That level of precision provided incredible clarity to both our sales and product teams as we tried to build the very best product and sales engine for this very specific audience definition. Execution: Metrics Dashboards.
Instead of wrestling with fragile, error-prone infrastructure, follow our best practices and deploy a push software tool engineered for precision, personalization, and privacy. In just a few clicks, you combine properties and events to craft ultra-specific segments and deploy targeted campaigns directly from the Userpilot dashboard.
As a product manager, Ive seen it become a constant loop of juggling SDKs, waiting on engineering sprints, patching together feedback tools, and praying your analytics make sense. No-code setup for fast deployment: Shipping product tours or checklists shouldnt be gated by engineering delays. in the first 30 days.
You end up with: Multiple roadmaps but no shared priorities PMs stepping on each others toes Dashboards galore, but zero signal Before long, youve built what we call a meeting maze. PMs dont win races by driving harderthey win when someones removing friction, refueling the engine, and handing them the data they need to stay ahead.
Our product engineers are empowered to build great features, fast. So we decided to do something contrary to our engineering principles – run our search infrastructure ourselves on Elastic Compute Cloud hosts, or EC2 as it’s known. In Intercom, we believe that shipping is our company’s heartbeat. Architecture of the system.
Too often companies say they are data-driven but when I actually look inside to see how teams are operating, I hear anecdotes like the following: "I look at dashboards when I get a chance, but there is so much going on that I'm not looking at them regularly." "I The best place to start is not by just throwing together a dashboard of metrics.
It’s even harder when product managers and engineers are bogged down with work that distracts them from their highest leverage activities of identifying problems and building products people want to use to solve those problems. So the question becomes, how can we reduce the time it takes engineers to fix issues? Measures of success.
With these new transactional messaging capabilities, you can reach your customers where they already are, using timely, relevant, personalized messages that are simple to set up and easy to measure – no engineering team required. Own the messaging from beginning to end – no engineer needed. Message type: Chat. Audience: Users.
Analytics Which platform gives teams the clearest insights without drowning them in dashboards? Its the self-serve analytics platform that transforms raw numbers into intuitive dashboards. Capitol AI AI-powered storytelling engine that turns raw data into insightful narratives. The Categories: Who Will Reign Supreme?
image resizing, multi-page dashboards) with simple UIs. We just created a working prototype of a CRM in less than five minutes—something that would have previously taken weeks of an engineer’s time. file conversion, job applicant tracking) and data-driven applications (e.g. Unbelievable.
How can growth engineering help you take your marketing up a notch? This is where growth engineering comes in handy. In this article, we will be discussing everything you need to know about the growth engineering framework and its processes. Technical skills are highly desirable but not mandatory for growth engineers.
Analytics Which platform gives teams the clearest insights without drowning them in dashboards? Its the self-serve analytics platform that transforms raw numbers into intuitive dashboards. Capitol AI AI-powered storytelling engine that turns raw data into insightful narratives. The Categories: Who Will Reign Supreme?
Open up a webpage, drop in a script, and boom: clicks, scrolls, and form inputs start flowing into your dashboard without writing a single line of code. Youll still need engineering to hook into custom views, navigation events, or gestures, especially if the app wasnt built with tracking in mind from the start. Mobile analytics ?
Inefficient dashboard configuration Traders often leverage dashboards to monitor data from personal accounts, control transactions and contracts, follow the latest currency market trends and shifts. To increase working efficiency, users can tweak dashboards and choose the most topical tabs. And here’s when UX testing steps in.
Engineers can see the exact conditions that trigger issues: Instead of relying on vague bug reports, engineers can watch sessions where users encounter errors, complete with console logs and network data. Track user engagement trends in Userpilot with interactive dashboards showing daily and weekly behavior patterns.
I just can’t make sense of this dashboard.”. Paul Grice , a 20th century philosopher of language who studied how conversation works, is a perennial touchstone for teams working in AI, linguistic engineering, and conversational design. We all know what a conversation between two people sounds like. Hey, can you help me a sec?”.
Its especially great for product and growth teams who want to drive user engagement, improve app performance, and act on insights without relying too much on engineering. Now, you can track how users interact with your app across platforms, understand their behavior in context, and respond with in-app experiences, all from the same dashboard.
Collaborating on digital product design with engineers or managers follows the same principles as the prisoners dilemmaboth of you can either cooperate or defect. For example, the more technical the product, the larger the designers technology gap that must be filled by an engineer. Prisoners dilemma in digital productdesign.
Their tightly packed visual dashboards organize the data in a way that makes it easy to map out sales funnels, track common paths, uncover behavior patterns, and identify friction points. In terms of reporting, UXCam’s drag and drop team dashboard is easy for non-technical team members to use. Product Analytics. Session Insights.
On the other hand, a technical product manager brings in-depth technical knowledge to guide the development process , often working closely with engineering and design teams. Facilitate collaboration between the product owner and the engineering team. Track key product metrics with analytics dashboards. Product vision benefits.
To prepare for the workshop, Tali created a fictional case study, and with the help of ChatGPT, she generated six interview snapshots and some analytics dashboards. Texthelp has very few designers who are shared across teams, and they have also been short on software engineering leads.
Thus, custom software development and engineers face the same challenges faced by the market demand. Most software engineers work in custom software development firms, so it’s easier for them to see which parts need continuous improvement. Next, people use cards or images to illustrate work items on the dashboard as work progresses.
A modern product team is made of highly intelligent, creative engineers and designers. I think a data visualization dashboard would be great as a first screen in the back-office.”. The original request was to ‘add a data visualization dashboard as a first screen on the product’. Antoine de Saint-Exupéry. Why do you think that?
Dashboards. You can track key metrics on mobile engagement with custom dashboards. Now, although you can perform retroactive analysis through tagging, you still need engineering help to track server-side events or add more complex setups. Custom dashboards and reports. Feature heatmaps. You must tag a feature to do this.
Embedded analytics solves these pain points by providing insights directly within your application, allowing sales teams to track performance metrics in their CRM and operations teams to monitor workflows through embedded dashboards. Processing: Transforming raw data into actionable insights through analytics engines.
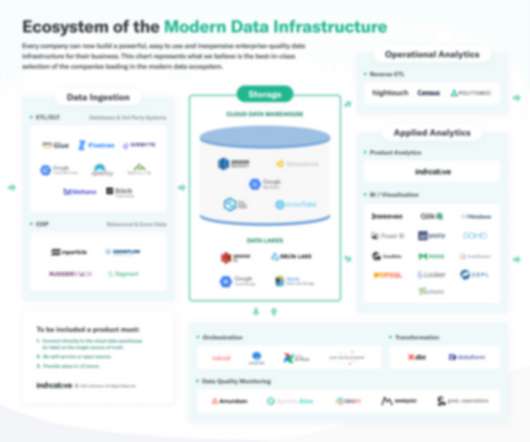
When I started my first company twenty years ago, in order for us to understand customer behavior, we had to buy servers, rack them, and use software engineers to gain insights. Visualization and BI tools are helpful in turning numbers into dashboards and visual representations of the underlying data. Applied Analytics.
Solution : To address data accuracy challenges without diverting engineering resources, Dealfront integrated Userpilot’s feedback widget. They added a ‘Report data issue’ icon to their dashboard , triggering a survey that allows users to report inaccuracies. The team added the ‘Report data issue’ icon to their dashboard.
In really large organizations, a lot of the people issues turn into how to maintain culture across the team, what the ratios should be between product and engineering and how they ensure that they’re not duplicating efforts across different team members. We gave the pod some metrics that they were accountable for moving.
We organize all of the trending information in your field so you don't have to. Join 96,000+ users and stay up to date on the latest articles your peers are reading.
You know about us, now we want to get to know you!
Let's personalize your content
Let's get even more personalized
We recognize your account from another site in our network, please click 'Send Email' below to continue with verifying your account and setting a password.


Let's personalize your content