This site uses cookies to improve your experience. To help us insure we adhere to various privacy regulations, please select your country/region of residence. If you do not select a country, we will assume you are from the United States. Select your Cookie Settings or view our Privacy Policy and Terms of Use.
Cookie Settings
Cookies and similar technologies are used on this website for proper function of the website, for tracking performance analytics and for marketing purposes. We and some of our third-party providers may use cookie data for various purposes. Please review the cookie settings below and choose your preference.
Used for the proper function of the website
Used for monitoring website traffic and interactions
Cookie Settings
Cookies and similar technologies are used on this website for proper function of the website, for tracking performance analytics and for marketing purposes. We and some of our third-party providers may use cookie data for various purposes. Please review the cookie settings below and choose your preference.
Strictly Necessary: Used for the proper function of the website
Performance/Analytics: Used for monitoring website traffic and interactions
Most product teams get mobile app analytics wrong. They track 47 different key performance indicators (KPIs) in their mobile analytics platform , spend hours debating dashboard numbers, yet can’t predict which users will churn next week The problem here isn’t a lack of data.
This post is about making these ideas concrete through a set of guidelines, templates, and JIRA+Excel tips so you can create effective status and progress reports quickly, have less meetings , and get out of the building , which is where you need to be. Templates and tips for less status meetings. Progress / Status.
Pro Tip: Pair your quick wins with data. A dashboard showing metrics like feature adoption or user engagement amplifies your credibility. Advanced Tactics: Stakeholder Mapping: Use tools like the Stakeholder Alignment Blueprint (available on jonihoadley.com) to identify key goals and concerns. Click here to download.
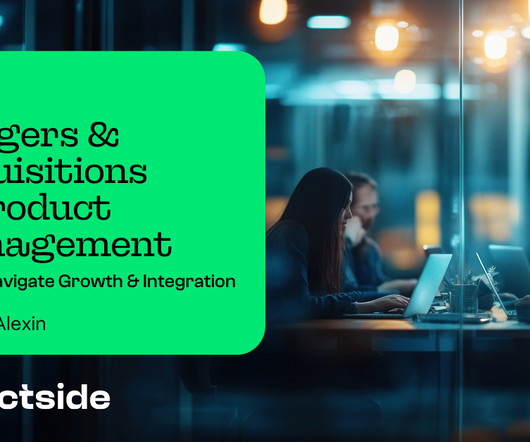
In our latest Productside webinar, Becoming an Effective Product Management Leader , Principal Consultants Roger Snyder and Kenny Kranseler delivered a no-nonsense roadmap for new leaders who want to nail their first 90 days (and beyond) and get the tools on how to become a product management leadereffectively. Do I push back?
Embedding dashboards, reports and analytics in your application presents unique opportunities and poses unique challenges. We interviewed 16 experts across business intelligence, UI/UX, security and more to find out what it takes to build an application with analytics at its core.
This report contains data from the following app categories: Finance. Personal Services. Business Services. Mobile consumer feedback changed product roadmaps, improved ROI, drove revenue, and got companies closer to achieving their overall business goals. Food and Drink. Healthcare. Media and Entertainment.
The following data and information on Business Services apps is from our 2022 Mobile App Customer Engagement Report. Brands in Business Services had varied experiences in 2021. Below is a short summary of how Business Services apps fared in 2021. Data included: Ratings and reviews. Download your copy here.
The following data and information on Shopping apps is from our 2022 Mobile App Customer Engagement Report. Subcategories for Personal Services Apps: Home and Family. Rather than comparing by benchmark, below is a short summary of both the Home and Family apps included in our data. Data included: Ratings and reviews.
Today, we’re thrilled to release our 2021 Mobile App Engagement Benchmark Report. Apptentive’s annual mobile app engagement benchmark report serves as a baseline to help you understand your app’s engagement strengths and areas for improvement. What’s New in the 2021 Report. See the Report.
Think your customers will pay more for datavisualizations in your application? But today, dashboards and visualizations have become table stakes. Discover which features will differentiate your application and maximize the ROI of your embedded analytics. Brought to you by Logi Analytics.
Listen to the audio version of this article: [link] A Product Strategy System The product strategy system in Figure 1 consists of four main parts: people, processes, principles, and tools. Are the right tools applied? Next, collect the relevant data. Are they properly empowered and adequately qualified? If so, what are they?
Insights on roadmaps, metrics, OKRs, and more for product managers. They use tools to help them with these responsibilities. Joining us for this episode is a CPO who shares some of the tools he uses, including roadmaps, metrics, and OKRs. 5:42] How do you use roadmaps? What is the solution?
” Solution-centric data : “We’re making great progress; we’ve implemented 50 more user stories, and velocity is up by eight points!” ” Sadly, the data above is not helpful to see clearly how much value the product is creating. This often leads to too much data being gathered. 2 Wrong Product KPIs.
Reveal Embedded Analytics We live in an era where data shapes decisions across industries. While datavisualizations have become essential, not all standard visualizations cater to specialized reporting needs. Dive in to discover its unmatched benefits and how you can craft unique reports effortlessly.
Product managers (PMs) must gather and analyze product data, create product roadmaps for multiple stakeholders, identify roadblocks, and track a long list of milestones—all while staying on a tight schedule. Using a visual planning tool like MindManager® can make this process a whole lot easier.
As they wait for the downloads to come, they realize—all too late—the fallacy of this assumption. If you’re ready to submit your app to the app stores next week, condense the most important elements of pre-launch into a one-week period and move the other items to your post-launch roadmap. IDENTIFY INFLUENCERS AND REPORTERS.
You can download the free, comprehensive e-guide, here. Surveys, combined with open text analysis, however, hold immense potential for uncovering deeper customer insights from customer feedback. Use these questions liberally to uncover richer insights. How can I demonstrate that CX efforts are driving business results?
How product managers can use data to understand customers and create value. Today we are talking about making better product decisions that create customer value using the data you already have. Our mission at Indicative is to help businesses build better products through data. 5:36] What is a data warehouse?
A recent Forrester Consulting study commissioned by Intercom, Drive Conversational Experiences For A Future-Ready Customer Support Strategy , revealed that 54% of teams can’t personalize support with their tech stack and 50% waste time jumping between tools. Download The Ultimate Modern Support Tech Stack guide. Let’s dive in.
Download this guide for practical advice on using a semantic layer to improve data literacy and scale self-serviceanalytics. The guide includes a checklist, an assessment, industry-specific use cases, and a data & analytics maturity model and roadmap.
If you arent invited to the diligence party, rattle some cages: Arm Corp Dev: Provide them a short list of mission-critical data you must have before closing. Get Your PM Leader First 90 Days template pack Download Now When Integration Feels Like a Circus Day 1 is everything, Brian said. Brians advice? People issues come first.
More tools. But throwing more tools or roles at it just creates noise if you dont solve the root problem. More PMs, more tools, more roadmapsand less alignment. PMs dont win races by driving harderthey win when someones removing friction, refueling the engine, and handing them the data they need to stay ahead. More teams.
The following data and information on Media apps is from our 2022 Mobile App Customer Engagement Report. Rather than a benchmark comparison, below is a short summary of the six subcategories included in our data: News, Telco, Technology, Games, Sports, and Music. Data included: Ratings and reviews. Popular phrases.
The following data and information on Utilities apps is from our 2022 Mobile App Customer Engagement Report. Data included: Ratings and reviews. DOWNLOAD THE FULL 2022 BENCHMARK REPORT HERE. Download your copy here. Additional visual benchmark data for Utilities apps. ?DOWNLOAD Popular phrases.
Get the tools to turn data into actionable insights and deliver personalized, relevant, timely messaging to increase conversions and maximize your ROI. Download this guide and receive: An interactive flowchart to assess where you are in your omnichannel journey. Multichannel and omnichannel marketing are not the same.
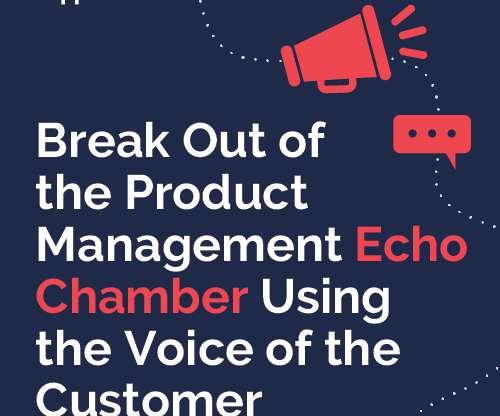
Our guide, Break Out of the Product Management Echo Chamber Using the Voice of the Customer, will help you understand the ins and outs of VoC data and how you can use that data to make better product decisions. Download the guide today ! How companies use VoC data . What you’ll learn. What is VoC. Why VoC is valuable .
So give designers bigger challenges like: “We should redesign the sign up flow to decrease drop-offs” or “add a new reporting module to this business app, so users can easily present their results”. The design team has to bring new insights from your customers all the time. What do designers expect from a product manager?
The following data and information is from our 2022 Mobile App Customer Engagement Report. Consumers in each subcategory have vastly different motivations and usage patterns, which we see represented in the data. Data included: Ratings and reviews. DOWNLOAD THE FULL 2022 BENCHMARK REPORT HERE.
But if you have a breather, we’re excited to share some data-backed mobile engagement findings, specifically surrounding how seasonality impacts customer sentiment! While we can hypothesize that the lack of Vitamin D certainly contributes to grumpier customers in the gloomier months, we needed data to support our claims.
It makes your app easier to find and increases the likelihood of it being downloaded. In fact, 72% of consumers say they only engage with personalized messaging, such as recommendations, messages, and visuals tailored to their behavior. Review your app analytics to identify underused features. Nike is the best example here.
The following data on mobile surveys and interaction and response rates is from our 2022 Mobile App Customer Engagement Report. While correlation isn’t causation, looking at overlapping data points can help us infer what bets paid off for mobile product teams, along with where they can adjust their roadmaps to improve.
You also might be reading this post thinking: “Who’s adding new tools to their tech stack right now?” Do you have the right tools to capture that voice? In order to help, we’ve taken the liberty of compiling a list of the best mobile in-app feedback tools for you. Core mobile in-app feedback tools & solutions.
It’s a tool I have developed specifically to help people describe the vision and strategy of their products. You can download the product vision board from my website and by clicking on the image below. How Does the Strategy Relate to the Vision and Roadmap? To capture the product strategy, you can use my product vision board.
Finally, you might be wrong and be missing out on potentially important insights because of an unwillingness to understand the person’s reasons. I think a datavisualizationdashboard would be great as a first screen in the back-office.”. Because otherwise users have to go to the reports screen, and they shouldn’t.
One look at your mobile app analyticsdashboard, and you just want to shut your eyes and scream in frustration. You aim to extract meaningful insights to improve app performance and user engagement. What decision will this data influence? Data is not fulfilling its value if it is not making an impact on your product.
Christy and Ashley share findings from Apptentive’s annual mobile app engagement benchmark report , which is based on data from more than 1 billion mobile consumer voices. They share insights applicable across the mobile landscape, as well as benchmarks specific to your industry. Want to download the slides from the webinar?
The following data originates from our 2022 Mobile Consumer Engagement Report, which can be read in full here. Apptentive’s data shows an average 30-day retention rate of 67%—an increase of more than three times the industry average, driven by proactive consumer engagement. Additional mobile app retention resources.
Customer feedback is one of the most valuable tools a business has at its disposal, but it’s often under-utilized. How hard are you working the following methods for customer insight collection ? Customer feedback insights will help your product team prioritize , make improvements, and achieve long-term goals. No ifs, no buts.
From learning more about their career path to predicted trends to general tips and advice, there’s no shortage of lessons to be learned that can ultimately help you develop and become a better product expert yourself. What strategies do you use to prioritize your product roadmap? What tools or methodologies do you use?
Mobile customer feedback – specifically customer sentiment and emotion data – is the biggest area of opportunity right now for finance apps. And in order to get there, we need to look at data from before the world changed while we try to interpret what comes next. You can download the full report here.
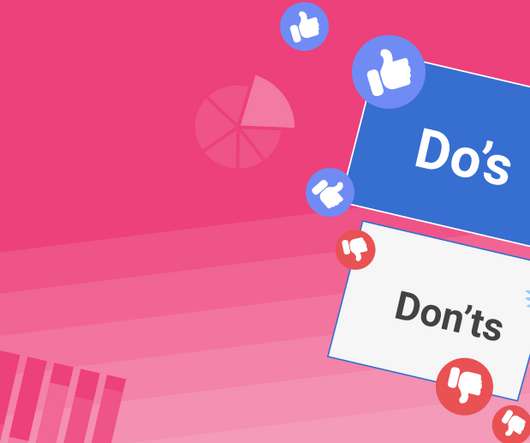
Reveal Embedded Analytics. It’s hard to believe that many organizations in today’s data-driven world are still struggling to make use of the vast amounts of data they possess and that for most, accessing and analyzing data remains a distant goal. The Do’s of Embedding Analytics Into Your Apps.
This post is written by Semetis , a data-driven marketing agency located in Brussels, Belgium. Here’s what you’ll learn: To be successful, organizations need more data. More importantly, they need the right kind of solutions to interpret that data, and drive actionable innovation across their organization.
Listen to the audio version of this article: [link] Download file | Play in new window | Duration: 10:10 | Recorded on September 13, 2022. How does it differ from a product roadmap and how do the two plans relate? With a validated strategy in place, you are in a great position to build an actionable product roadmap.
From learning more about their career path to predicted trends to general tips and advice, there’s no shortage of lessons to be learned that can ultimately help you develop and become a better product expert yourself. What strategies do you use to prioritize your product roadmap? What tools or methodologies do you use?
We organize all of the trending information in your field so you don't have to. Join 96,000+ users and stay up to date on the latest articles your peers are reading.
You know about us, now we want to get to know you!
Let's personalize your content
Let's get even more personalized
We recognize your account from another site in our network, please click 'Send Email' below to continue with verifying your account and setting a password.


Let's personalize your content