This site uses cookies to improve your experience. To help us insure we adhere to various privacy regulations, please select your country/region of residence. If you do not select a country, we will assume you are from the United States. Select your Cookie Settings or view our Privacy Policy and Terms of Use.
Cookie Settings
Cookies and similar technologies are used on this website for proper function of the website, for tracking performance analytics and for marketing purposes. We and some of our third-party providers may use cookie data for various purposes. Please review the cookie settings below and choose your preference.
Used for the proper function of the website
Used for monitoring website traffic and interactions
Cookie Settings
Cookies and similar technologies are used on this website for proper function of the website, for tracking performance analytics and for marketing purposes. We and some of our third-party providers may use cookie data for various purposes. Please review the cookie settings below and choose your preference.
Strictly Necessary: Used for the proper function of the website
Performance/Analytics: Used for monitoring website traffic and interactions
Today, we’re thrilled to release our 2021 Mobile App Engagement Benchmark Report. Apptentive’s annual mobile app engagement benchmark report serves as a baseline to help you understand your app’s engagement strengths and areas for improvement. What’s New in the 2021Report. See the Report.
Do you have the right tools to capture that voice? To help you with this, we compiled a list of the top mobile in-app feedback tools of 2021. Incorporating these tools into your customer experience tech stack will drive more engagement, gather high-quality customer feedback, and help inform your product roadmap.
The following data and information on Shopping apps is from our 2022 Mobile App Customer Engagement Report. Subcategories for Personal Services Apps: Home and Family. Rather than comparing by benchmark, below is a short summary of both the Home and Family apps included in our data. Data included: Ratings and reviews.
The following data and information on Business Services apps is from our 2022 Mobile App Customer Engagement Report. Brands in Business Services had varied experiences in 2021. Below is a short summary of how Business Services apps fared in 2021. Data included: Ratings and reviews.
Speaker: Speakers from SafeGraph, Facteus, AWS Data Exchange, SimilarWeb, and AtScale
Data and analytics leaders across industries can benefit from leveraging multiple types of diverse external data for making smarter business decisions. Data and analytics specialists from AWS Data Exchange and AtScale will walk through exactly how to blend and operationalize these diverse data external and internal sources.
Brands in the Business Services category faced diverse 2020 challenges. In our 2021 Mobile App Engagement Benchmark Report , a study of 1,000 apps across a billion+ app installs, we take a close look at apps in the Business Services category. Below is a summary of our research specifically on Business Services apps.
I’m going to take a wild guess and assume that you already understand the importance of mobile in-app feedback tools. You also might be reading this post thinking: “Who’s adding new tools to their tech stack right now?” Do you have the right tools to capture that voice? Mobile in-app feedback tools & solutions.
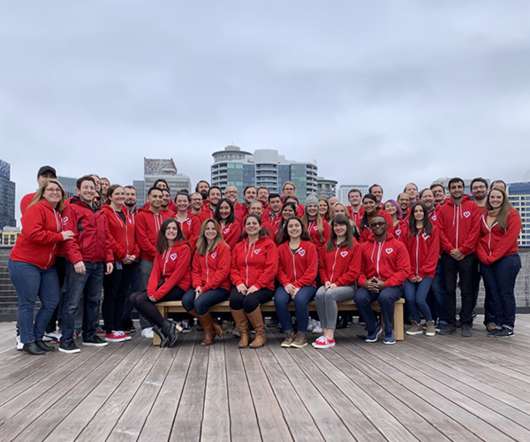
From celebrating our ten-year anniversary to being recognized as one of the 100 Best Companies to Work For by Seattle Business Magazine to the publication of our sixth annual Mobile Customer Engagement Benchmark Report and much more detailed below, 2021 was a tremendously successful and exciting year for Apptentive.
Subcategories: Restaurant, Food Services. In our 2022 Mobile Customer Engagement Benchmark Report , a study of more than 1,000 apps across a billion mobile app installs, we take a close look at apps in the Food and Drink category. Data included: Ratings and reviews. Download the full 2022 Benchmark Report here.
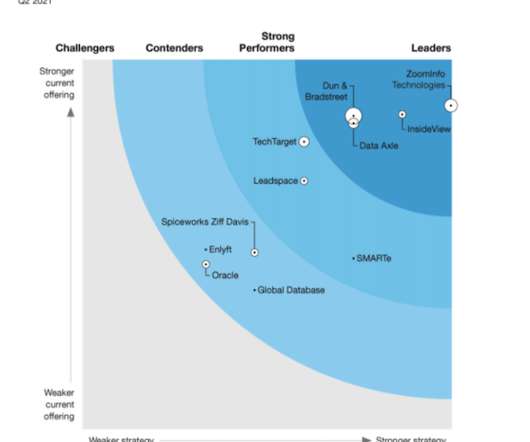
In our 24-criterion evaluation of B2B marketingdata providers, we identified the 11 most significant vendors — Data Axle, Dun & Bradstreet, Enlyft, Global Database, InsideView, Leadspace, Oracle, SMARTe, Spiceworks Ziff Davis, TechTarget, and ZoomInfo Technologies — and researched, analyzed, and scored them.
If 2020 was the shift to mobile, 2021 was the year we saw it reflected in the numbers. This report contains data from the following app categories: Finance. Personal Services. Business Services. The post Introducing: 2022 Mobile Customer Engagement Benchmark Report appeared first on Apptentive. Healthcare.
In our 2021 Mobile App Engagement Benchmark Report , a study of 1,000 apps across a billion+ app installs, we take a close look at apps in the Education category. Read on for data-supported research and benchmarks Education apps should focus on in 2021 and beyond based on what was learned from a year like no other.
How product managers can use visual storytelling to make their ideas stand out. As we move into 2021, the name of this podcast is changing to better reflect our objective here—product managers become product masters. Using visuals to help communicate information can be very helpful. That new name is Product Masters Now.
Defining Continuous Discovery: Setting a Clear Benchmark In my book that came out in May of 2021, I decided to define continuous discovery. This definition is a mouthful, so I like to visualize it. I’m going to walk through this visual quickly, and then Cecilie and I are going to dive into this in more depth.
Speaker: Phil Irvine, VP & Director of Audience Intelligence
One-to-one communication has been a trendy philosophy for marketers and advertisers for years now. To accomplish this, organizations have traditionally leaned into historical customer and product data to predict how to engage with their current and future customers in a personalized manner.
To help your finance app stand out in 2021, focus on these four strategies at the start of the new year. Money is highly personal, and given the intensity of emotions associated with money, it strikes us as odd that more financial institutions have yet to tap into this gold mine of customer emotion data and CX insight.
In our 2021 Mobile App Engagement Benchmark Report , a study of 1,000 apps across a billion+ app installs, we take a close look at apps in the Utilities category. Read on for data-supported benchmarks Utilities apps should focus on in 2021 and beyond based on what was learned from a year like no other.
In our 2021 Mobile App Engagement Benchmark Report , a study of 1,000 apps across a billion+ app installs, we take a close look at apps in the Media and Entertainment category. In our data, Media apps are segmented into six subcategories: News (global news networks, newspapers, etc.). 2021 Engagement Benchmarks for Media Apps.
One size did not fit all for Personal Services apps in 2020. In our 2021 Mobile App Engagement Benchmark Report , a study of 1,000 apps across a billion+ app installs, we take a close look at apps in the Personal Services category. 2021 Engagement Benchmarks for Personal Services Apps. Consumer Engagement.
Speaker: Rhonda Basler, Director of Customer Engagement, Hallmark Business Connections
You don’t need the latest, greatest CRM technology or datavisualizationtools. Using your innate empathy and applying that to your marketing and customer experience through emotional intelligence CAN be the game changer you’re looking for. Wednesday January 20, 2021 at 11AM PST, 2PM EST, 7PM GMT
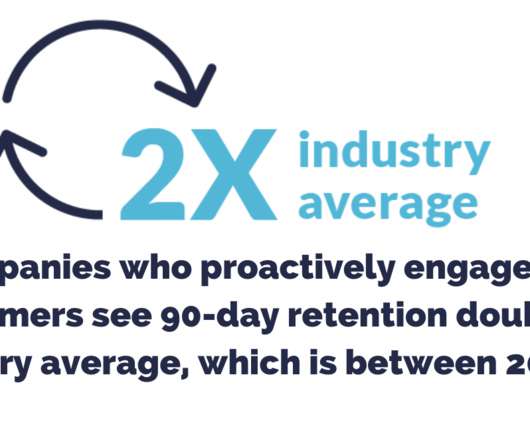
As you act on your 2021 app retention strategy, here are the app retention benchmarks to aim for. App Retention in 2021. Retention is a primary focus in Apptentive’s 2021 Mobile App Engagement Report , a study of 1,000 apps across a billion+ app installs. However, 90-day retention isn’t great for the average mobile app.
First-party data is the future of online engagement and customer experiences. In June 2021, Google confirmed that it will no longer track individuals online via cookies. One aspect that can’t be debated is the value of first-party data as we proceed into this cookieless future. What is first-party data?
The following data and information on Utilities apps is from our 2022 Mobile App Customer Engagement Report. Brands in the Utilities industry faced various hurdles throughout 2021. Below is a short summary of how Utilities apps fared in 2021. Data included: Ratings and reviews. Summary of Utilities apps in 2021.
Data is the engine for SaaS, but without dataanalyticstools , your SaaS team will not be able to make sense of the data. The right set of SaaS analyticstools can help you generate actionable insights that fuel strategic decisions. But how do you ensure you’re picking the right tools?
Which product analyticstools should you be using? How many analyticstools do you need? And what type of analytics really matters for a product marketing manager? By the end, you'll know the only type of analyticstools you really need as a PMM. What is product analytics?
How product managers can use data to understand customers and create value. Today we are talking about making better product decisions that create customer value using the data you already have. A PR person contacted me about a company that received the 2021 Products That Count award in the Operate category.
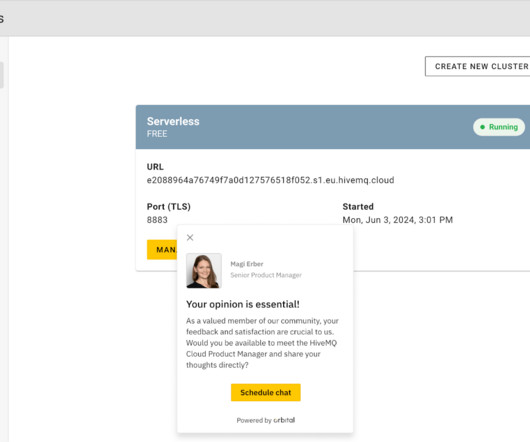
For today’s Tools of the Trade , we caught up with Yury Oleynik , the VP of Product Management at HiveMQ , who has managed to make continuous interviewing a reality on his team. Yury shares a few of the tactics his team tried to automate recruiting before they came across the tool they’re currently using, Orbital.
The following data and information on Media apps is from our 2022 Mobile App Customer Engagement Report. Rather than a benchmark comparison, below is a short summary of the six subcategories included in our data: News, Telco, Technology, Games, Sports, and Music. Data included: Ratings and reviews. Popular phrases.
Continuing to climb in G2’s quarterly industry rankings, Indicative was again named a Leader in Customer Journey Analytics by G2 in their 2021 Winter Report. Indicative provides actionable insights in seconds that empower teams to optimize customer engagement, increase conversion, and improve retention. Why We’re Leaders.
The following data on mobile surveys and interaction and response rates is from our 2022 Mobile App Customer Engagement Report. While correlation isn’t causation, looking at overlapping data points can help us infer what bets paid off for mobile product teams, along with where they can adjust their roadmaps to improve.
With AI technology, marketers can identify microtrends and even predict trends, saving time and resources through automated digital marketingservices. The marketing industry is not immune to this digital transformation, as prominent brands are beginning to take advantage of the opportunities it presents.
The following data and information on Travel apps is from our 2022 Mobile App Customer Engagement Report. In 2021, Travel began its road to recovery following interstate, national, and global travel restrictions brought on by the pandemic. Data included: Ratings and reviews. DOWNLOAD THE FULL 2022 BENCHMARK REPORT HERE.
In 2021, brands talked to more of their consumers than ever before, while clearly shifting their strategies toward retention. The following data originates from our 2022 Mobile Consumer Engagement Report, which can be read in full here. But in 2021, the risk of churn to both Fans and Risks was comparable throughout the year.
In our 2021 Mobile App Engagement Benchmark Report , a study of 1,000 apps across a billion+ app installs, we take a close look at apps in the Food and Drink category. Read on for data-supported research and benchmarks Food and Drink apps should focus on in 2021 and beyond based on what was learned from a year like no other.
The following data and information is from our 2022 Mobile App Customer Engagement Report. Below is a summary of how Finance app fared over the course of 2021. Below is a summary of how Finance app fared over the course of 2021. Data included: Ratings and reviews. DOWNLOAD THE FULL 2022 BENCHMARK REPORT HERE.
Here we provide a brief overview of the best app developers for startups for 2021. The selection of companies is based on data provided by Clutch, GoodFirms, Business of Apps, and Mobile App Daily. The company provides design and mobile app development services for businesses of all types. You’re in the right place!
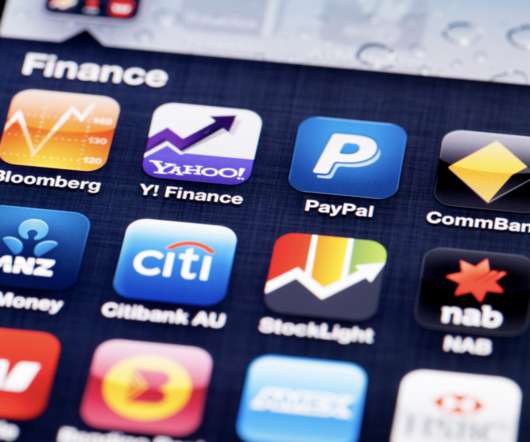
In our 2021 Mobile App Engagement Benchmark Report , a study of 1,000 apps across a billion+ app installs, we take a close look at apps in the Finance category. In this report, Finance apps are separated into three subcategories: Fintech (credit score, mortgage, stocks and bonds, loan consolidation, etc.), Ratings and Reviews.
In our 2021 Mobile App Engagement Benchmark Report , a study of 1,000 apps across a billion+ app installs, we take a close look at apps in the Healthcare category. In our research, Healthcare apps are divided into two subcategories: Medical (public health, condition management, reproductive services, insurance, etc.)
But if you have a breather, we’re excited to share some data-backed mobile engagement findings, specifically surrounding how seasonality impacts customer sentiment! While we can hypothesize that the lack of Vitamin D certainly contributes to grumpier customers in the gloomier months, we needed data to support our claims.
According to the Nielsen Norman Group, quantitative data can identify where users encounter problems, but it often fails to explain why those problems occur Nielsen Norman Group,2023. The Emergence of Research-Driven Growth Authentic growth lies not only in analyzing quantitative data but in deeply understanding user behavior and motivations.
Apptentive’s annual Mobile App Engagement Report serves as a baseline to help app publishers across categories understand their app’s engagement strengths and areas for improvement. And today I am super excited to share some of the key insights from our 2021 Mobile App Engagement Benchmark Report.
In our 2022 Mobile Customer Engagement Benchmark Report , a study of more than 1,000 apps across a billion mobile app installs, we take a close look at apps in the Healthcare category. Healthcare apps are divided into three subcategories: Medical (public health, condition management, reproductive services, etc.) and Health Insurance.
It has also changed how we interact with our favorite stores, restaurants, and service providers – even our healthcare providers. According to State of the Connected Customer , a report from Salesforce, 84 percent of customers say the experience a company provides is as important as its products and services.
Software-as-a-service (SaaS) models, which operate on a subscription basis and are centralized and situated on a remote cloud network, are increasingly popular with businesses for a variety of factors, including flexibility and affordability. Saas startups that provide software as a service have a good delivery model. What Is Saas? — Brief
We organize all of the trending information in your field so you don't have to. Join 96,000+ users and stay up to date on the latest articles your peers are reading.
You know about us, now we want to get to know you!
Let's personalize your content
Let's get even more personalized
We recognize your account from another site in our network, please click 'Send Email' below to continue with verifying your account and setting a password.


Let's personalize your content