This site uses cookies to improve your experience. To help us insure we adhere to various privacy regulations, please select your country/region of residence. If you do not select a country, we will assume you are from the United States. Select your Cookie Settings or view our Privacy Policy and Terms of Use.
Cookie Settings
Cookies and similar technologies are used on this website for proper function of the website, for tracking performance analytics and for marketing purposes. We and some of our third-party providers may use cookie data for various purposes. Please review the cookie settings below and choose your preference.
Used for the proper function of the website
Used for monitoring website traffic and interactions
Cookie Settings
Cookies and similar technologies are used on this website for proper function of the website, for tracking performance analytics and for marketing purposes. We and some of our third-party providers may use cookie data for various purposes. Please review the cookie settings below and choose your preference.
Strictly Necessary: Used for the proper function of the website
Performance/Analytics: Used for monitoring website traffic and interactions
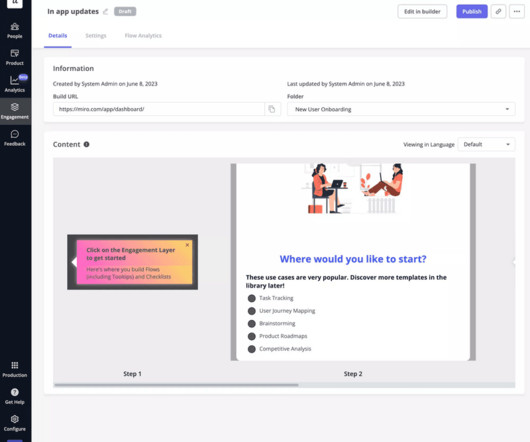
As you’re researching dashboardreportingtools, you’ve probably noticed how hard it is to find reliable information on the available solutions. TL;DR Dashboards display critical business data in real-time, streamlining decision-making and focusing on key metrics. Let’s dive in!
As you’re researching customer analytics platforms, you’ve probably noticed how hard it is to find reliable information on the available solutions. TL;DR Customer analytics platforms are specialized tools that allow you to collect and analyze data. Starts with Einsten Predictions’ $75/month billed annually.)
When it comes to boosting your product growth, user tracking tools can make your life a lot easier. They offer insights into product performance , what your users are doing inside your product, and why they are doing it. But how do you know you’re picking the right tools? Tableau is the best user datavisualizationtool.
Which product analyticstools should you be using? How many analyticstools do you need? And what type of analytics really matters for a product marketing manager? By the end, you'll know the only type of analyticstools you really need as a PMM. What is product analytics?
Like any form of analytics, product marketing analytics is all about capturing key data and optimizing the customer experience using that data. Unlike marketing analytics which focuses on replicating marketing successes, product analytics focuses on improving the product. What is product analytics?
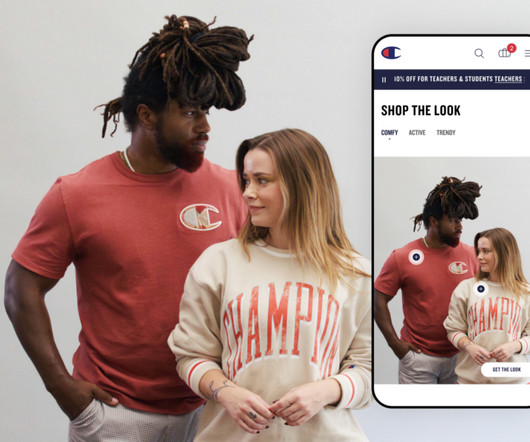
Fueled by product insights and strategy, the work exceeded every key metric. Written by Michael Agombar Many times, we see a client’s data collection methods to be lacking, in which case we create analytic tracking plans. Luckily for us, our client, Champion , the iconic retail brand, had analytics that were incredibly strong.
According to McKinsey , data-driven organizations are 23 times more likely to acquire customers. In order to be data-driven, one has to carefully consider the product analyticstools he is using. However, there are so many vendors on the market that it can easy to lose track of which tools are worth consideration.
I’m often asked what KPIs B2B/enterprise product folks should use, or what OKRs they should choose. But this raises three broad questions: Shouldn’t we spend more time choosing our specific KPIs (or OKRs) than deciding whether to adopt metrics in general ? Why KPIs from consumer companies don’t fit well with B2B/enterprise.
And I love graphs, metrics, and the data that powers them because they communicate results and inspire ideas. And at the heart of the OKR system lies metrics and data. So I took these and worked with our data science and customer success teams to understand the product metrics (KPI’s) that influence these results the most.
But today, the underlying backbone of all of it is the right data. While science has always been part of sales, it’s hard to ignore the increasing importance of taking a data-driven approach to growing your business. As a sales rep, you need to be comfortable understanding the data behind your pipeline. New business KPIs.
According to Gartner, more than 3,000 CIOs ranked Business Intelligence (BI) and Analytics as the top differentiating technology for their organizations. If BI and Analytics is such a game-changer, then why is the average adoption rate in organizations only 32%? On Jan 29, Birst will introduce Smart Analytics powered by Coleman AI.
How do you deliver more insights out to more people? Operationalizing BI and analytics – that is, putting the power of data in the hands of everyone across the enterprise, not just analysts and data scientists – has always been the mantra for Birst co-founder Brad Peters. Do you see the bottleneck?
Without product analytics, how do you know how to move the needle with your product growth? If you’re only beginning your adventure with product analytics, looking at all the usage data may seem overwhelming at first glance: Source: Heap. Here are the need-to-know takeaways: What is Product Analytics?
In this blog, we’ll handpick a few A/B testing tools worth your attention. It provides product, marketing, and sales teams with data-driven insights and facilitates decision-making. A/B testing tools let you compare different versions of something and monitor test results to identify the most effective variation.
Therefore, I have asked six of UserZoom’s brightest minds (who also happened to be willing to stake their hard-earned reputations on these predictions) about how they think the CX and UX landscapes will shape up in 2020. UX Researcher, Professional Services. Becky Wright, Senior Product UX Researcher. Lee Duddell, Senior UX Director.
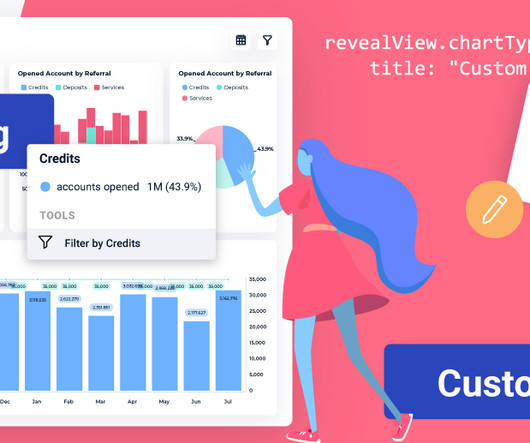
Reveal Embedded Analytics Welcome to Reveal 1.6.0! This release brings a host of enhancements, bug fixes, and exciting new features that will refine the way you interact with your data. This seamless and intuitive experience allows you to filter your entire dashboard on the fly, revolutionizing the way you interact with your data.
Our product was a script that you put on your website so it unblocks your analytics when they are blocked by any kind of content blockers. The big issue was that in the context of very low budget, the extra data was just a nice-to-have for marketing teams. It wasn’t helping them much. The explanation was simple: we were a vitamin.
Recommended product manager job openings in data-driven companies 1. Millions of companies, from the worlds largest enterprises to the most ambitious startups, use Stripe to accept payments, grow their revenue, and accelerate new business opportunities. Who would be the best fit for this job? Who would be a bad fit for this job?
Having trouble deciding which customer serviceKPI to use? There are some vanity metrics among the KPIs for customer service. So let’s look at the most important KPIs that will help you create strategies to provide superior customer service and boost retention. What are customer serviceKPIs?
UX KPIs, or user experience key performance indicators, are essential numerical data points that are used to track, measure, and compare the experience users have with your SaaS product. So, if you’re a product manager looking to significantly improve your UX efforts and provide actionable insights to your UX team, read on!
Your mind runs through your dashboard. In practice companies struggle with settling for just one top KPI, and with good reason. North Star Metric, One Metric, top business KPI?—?are The more value you capture the more money, data and other resources you have to invest in delivering yet more value to the market.
But as data-driven decision making takes on increased significance, we’ve seen “ product ops ” emerge to fill in the gap between the leadership and vision aspects of the product management and the facts and figures that inform team members. Manage with data: While we used to beg for information, now we find ourselves drowning in it.
In these blog posts, we ask the presenters to share their insights - we encourage you to watch the full on-demand webinars for even more details. In his webinar, experienced B2C and B2B product leader Tim Herbig , author of Lateral Leadership: A Practical Guide for Agile Product Management , shows how to be a data-informed product manager.
In this comprehensive guide, we’ll break down underlying customer activation strategies and actionable strategies, specific onboarding tools , and techniques, and tangible examples to learn from. You can’t create an engaged, loyal customer without the right tool for the job. Data is power. What are you waiting for?
Meanwhile, smaller companies need more tactical support around managing data, tools, and communications. Where does the product operations domain intersect with data? A strong product operations worker must know the product well, which demands deep curiosity and insight. Getting familiar with data is key to success.
Most SaaS companies start with a free software offering – providing a preview of their product’s capabilities before encouraging their users to grow into pro or enterprise solutions. Vidyard initially built and marketed themselves as an enterprise-focused company. Vidyard did the opposite. Flipping the freemium model on its head.
With a tool like Userpilot , you can create all of these without a single line of code. 10 Customer retention KPIs and metrics to measure retention. Here are 10 of the most important KPIs and metrics that help you measure customer retention rate. Retention KPI #1 Customer retention rate. Retention KPI #4 DAU to MAU rate.
While product growth may seem as simple as “attract customers to your Software-as-a-Service solution” there are countless SaaS challenges and customer issues that you’ll need to overcome along the way. As the number of software tools and subscriptions increase, so too do the expectations of SaaS customers.
Cloud, digital transformation, mergers and acquisitions, big dataanalytics, data monetization, and more are all critical business initiatives creating an even greater divide between centralized IT and decentralized analytic teams in the business. Register for the Birst 7 online product launch event, scheduled for June 5.
As we indicated in our previous blog, AIOps (Artificial Intelligence for IT Operations) refers to the application of machine learning analytics technology that enhance IT operations analytics. Proactively learn about issues that may affect service delivery down the line. 6 Metric aggregation and service quality indicators.
Note: Many people go from some desired growth metric (which is not a strategy) to define outputs (features) and then build a roadmap (vanity tactics as they are void of discovery efforts/evidence/data) and head straight for delivery to build those solutions using expensive resources/occupying the attention of precious talent.
At the start of 2017 I made several predictions about UX design and research. Below is a recap of how my 2017 predictions (from Jan of this year) turned out. I had predicted that we would see some increase in qualitative, fast, iterative usability studies in 2017. I had predicted a growing need for Competitive UX Benchmarks.
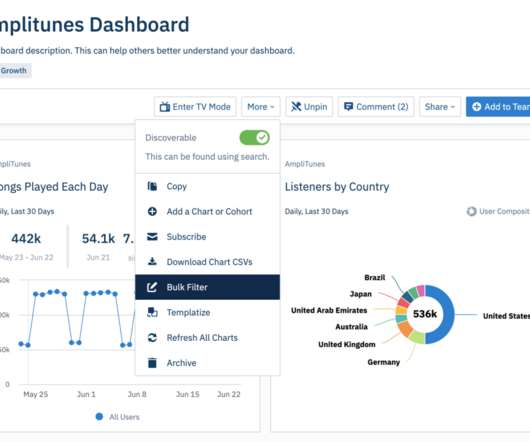
New in Analytics. Available on the Enterprise, Growth, and Scholarship plans. Amplitude strives to deliver clear, actionable insights with every aspect of our platform. Pathfinder now counts total conversions for a given sequence you select on the chart, and visualizes it at the top of the page. New in Pathfinder.
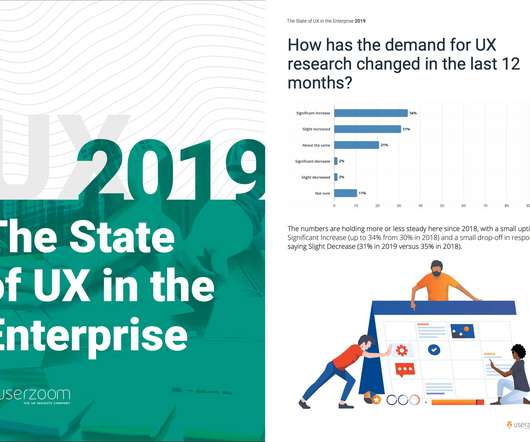
Over the last couple of years we’ve surveyed hundreds of people from some of the biggest companies in the world to discover the current UX landscape in enterprise organizations. The results, as featured in our 2019 State of UX in the Enterprise survey , are a revealing array of common challenges and trends.
ranging from startups with only a handful of engineers to large enterprises with thousands of PMs. PMs will then ask for more dashboards, but whenever they need to explain why a metric changed they say they’ll “get back to that next meeting” (and they never do). Good product teams execute against their vision in 10% increments.
Keep your team engaged with the data, with our new Slack integrations! If an insight is discovered, but nobody else on your team knows about it, was it really discovered? When new content (chart, dashboard, or notebook) gets shared in that Team Space, it’ll also send a slack notification to the team. Available for all customers.
Our customer success teams cover small, mid-market, and enterprise, with customer operations and customer support teams. We have enterprise customers like 3M and Costco too. Nick: Can you elaborate on the KPI concept for the participant side? . The next question is, how do we bring it all together through data?
This article was authored by Sheryl Estrada , Senior Reporter at Fortune, and originally published in CFO Daily. . KPIs, or key performance indicators, measure how effectively a company is achieving key business goals. Some emerging KPIs Schrage noted include employee experience, customer experience, and customer lifetime value.
In between “scrappy startup” and “enterprise behemoth” lies the mid-size company. They don’t have nearly the same resources as their larger, enterprise-class competitors who can outspend you. Even if your product is functionally superior, larger companies can fund more loss-leading land grabs and concierge-level customer service.
Real value pops up when you calculate LTV of your enterprise customers vs. business subscribers vs. professional users or long-time customers vs. newer customers (or any other categorization you see fit). Looking at the Technology Adoption Lifecycle Model, your LTV is a major KPI once in the Early Adopters phase—just before the chasm.
With over 17 years of experience as a designer, he primarily assists others in their career growth by providing thoughtful, concise tips and tricks, whether related to tools or any form of communication. When I got into design, it was very much for the visual aspect of it. Dan is an active member on LinkedIn with over 30k followers.
She was most recently customer success head at BetterWorks where she led services, customer support management, ops, and training team. Prior to that, Adam held executive roles at Yesmail for over nine years, heading customer experience, product dev, and technology services teams. Are you selling more to enterprises?
Enter mobile app analytics software that unlocks insights and empowers smarter decisions. What is mobile analytics software, and why do you need it? Mobile analytics software is a suite of tools designed to help you track, measure, and understand how your mobile app performs and how users interact with it.
From the simple: an app on your smartphone to approve purchase requisitions, to the complex: integration of the CRM, the Marketing systems, and the ERP system to provide deep insight into the function and flow of business, and much more were realized every day. Was it deep dataanalytics to help drive operational efficiencies?
We organize all of the trending information in your field so you don't have to. Join 96,000+ users and stay up to date on the latest articles your peers are reading.
You know about us, now we want to get to know you!
Let's personalize your content
Let's get even more personalized
We recognize your account from another site in our network, please click 'Send Email' below to continue with verifying your account and setting a password.


Let's personalize your content