This site uses cookies to improve your experience. To help us insure we adhere to various privacy regulations, please select your country/region of residence. If you do not select a country, we will assume you are from the United States. Select your Cookie Settings or view our Privacy Policy and Terms of Use.
Cookie Settings
Cookies and similar technologies are used on this website for proper function of the website, for tracking performance analytics and for marketing purposes. We and some of our third-party providers may use cookie data for various purposes. Please review the cookie settings below and choose your preference.
Used for the proper function of the website
Used for monitoring website traffic and interactions
Cookie Settings
Cookies and similar technologies are used on this website for proper function of the website, for tracking performance analytics and for marketing purposes. We and some of our third-party providers may use cookie data for various purposes. Please review the cookie settings below and choose your preference.
Strictly Necessary: Used for the proper function of the website
Performance/Analytics: Used for monitoring website traffic and interactions
In this conversation on The Product Experience podcast, Nacho Bassino shares his extensive experience in product management and coaching, discussing the evolution of the field, the importance of understanding business impact, and practical tools like KPI trees.
When it comes to implementing this for your product, there isn’t much information on how to do this. This article will drive you through the journey on how to apply TTM KPI in your organization. Read more » The post Applying a ‘Time-To-Market’ KPI in product appeared first on Mind the Product.
Then ask yourself how you can tell that these goals have been met. Additionally, include health indicators, metrics that measure how healthy your product and team are, as I explain in more detail in the article How to Choose the Right KPIs for Your Product. Don’t forget to regularly review and adjust your KPIs.
Learn about the importance of mobile app KPI dashboards and copy dashboards from real mobile app product managers, engineers and designers. A key performance indicator (KPI) dashboard is a visual representation of data that quantifies how well a team is performing towards its goals. How do I create a mobile app KPI dashboard?
Speaker: Shardul Mehta, VP of Product Management, American Well
Those are all valuable to track, but they're not your #1 KPI. Because to understand your #1 KPI, you need to understand your primary job as a product manager. He'll share the #1 KPI you must track to ensure your product delivers true business value - and how to align your teams around it. Bugs resolved? Sprint velocity?
But the second part, acquire an initial user base , would require the introduction of a new KPI in order to understand if the acquisition goal has been met. Instead, explain to them how effective product KPIs are derived , and consider inviting them to the next product strategy workshop in order to collaboratively determine the right KPIs.
A close look at key performance indicators (KPIs) and the impact they have on the efficacy of User Experience (UX). A great understanding about howKPIs can inform your UX research on both a qualitative and quantitative level. The post How to assess the efficacy of UX: KPI methods appeared first on TryMyUI Blog.
Do you need some behavioral KPI examples to understand what metrics to track and why? Behavioral key performance indicators (KPIs) can help you understand user experience and measure feature adoption. TL;DR Behavioral KPIs refer to metrics that track and measure customer behavior and engagement with your products or services.
By the time youve optimized for a particular KPI, your competition may already be moving on to the next opportunity. In the coming articles, well explore how to challenge and dismantle these sacred practices. Metrics are another comforting illusion. They provide numbers that seem to quantify success. The good news? You can break free.
With an abundance of product analytics to track, having a robust SaaS KPI dashboard is essential to monitor the metrics that matter most. This guide will walk you through what it is, why you need one, and how to build your very own dashboard. What is a SaaS KPI dashboard? How to build a SaaS KPI dashboard?
If you release a product or feature and start looking at the KPIs every waking hour, changing things on the fly when the KPI doesn’t immediately move in a positive direction, you will be acting against background noise and ruining any results by course-correcting against it. Picking the Wrong North Star Metric.
And if I’m measuring on a specific outcome, let’s say like user growth, and an executive is measuring on a different ruler motivated by a different KPI or incentive structure, it’s really hard to reconcile those things because you’re measuring things differently. It’s an issue because you always measure yourself on your own ruler.
“Mastery of the soft skills contributes to success in the conventional KPIs” In developing your own KPI model, we recommend getting feedback and guidance from your more tenured reps and engineers as they are the ones on the front line day in and day out. They will know whether or not these KPIs are achievable.
It is an indispensable KPI because it indicates how many of your users have stayed loyal. . This metric is difficult to grow organically; therefore, retention numbers should be a major KPI from day one. Session length is a good KPI to use as a baseline for app engagement. How many downloads is a realistic goal?
Instead of making one-dimensional decisions based on what the data, KPI or OKR says, they have the ability to integrate intuitive knowledge of how the organization thinks and feels into the decision at hand. He knew how to work the unwritten, unmapped human system to get the unit whatever it needed. Radar was different.
How to set product KPI without being limited by data? Why do we base product KPI on data to begin with . Product KPI is defined so we can measure how well the new feature works or resolve an AB testing. Defining product KPI based on existing data is like looking for the solution under spotlight.
Goals / KPIs. What’s the current status of our goal/KPI? How is it moving (vs target)? In others, it might be Slack, or a shared document/wiki page with a simple format that people know how to get to (and that you regularly remind me them to have a look). How to create this with JIRA and Excel.
But the second part, acquire an initial user base , would require the introduction of a new KPI in order to understand if the acquisition goal has been met. Instead, explain to them how effective product KPIs are derived , and consider inviting them to the next product strategy workshop in order to collaboratively determine the right KPIs.
preset quarterly goals or strategic need to focus on a new KPI) A broader change in your industry and/or prototypical customer’s life (e.g. How to Write Great Product Specifications was originally published in Product Coalition on Medium, where people are continuing the conversation by highlighting and responding to this story.
Go ahead and skip directly to the product marketing KPIs list or continue to read if you’re just starting out and looking to understand more about what product marketing is first. What is a Product Marketing KPI metric? Product Marketing KPIs vs Product Marketing OKRs. How to measure Product Marketing success?
Figure 3 illustrates how this can be done. Then, determine how to address it, for instance, by interviewing target customers or creating a throwaway prototype. Figure 3: Product Strategy Validation Start the process by identifying the biggest strategy risk. Next, collect the relevant data.
We created multi-disciplinary teams that own specific business KPIs, together with their internal users. For example, our Competence Centre Inventory Management co-owns merchandise availability (an important KPI for every retailer) with the merchandise planners. Traditionally, these two are different roles with different skill sets.
The main pain point in the above use case is how to provide the best value, best customer benefit, or the best customer experience for the high-value customers. How can we delight the customers through offerings or product experiences so they can stick with us and bring more revenue.
10 Customer retention KPIs and metrics to measure retention. Here are 10 of the most important KPIs and metrics that help you measure customer retention rate. Retention KPI #1 Customer retention rate. How to improve customer retention rate? In this way, customers gain a better understanding of how the product works.
Having trouble deciding which customer service KPI to use? There are some vanity metrics among the KPIs for customer service. So let’s look at the most important KPIs that will help you create strategies to provide superior customer service and boost retention. Customer service KPI #1 Customer Satisfaction Score.
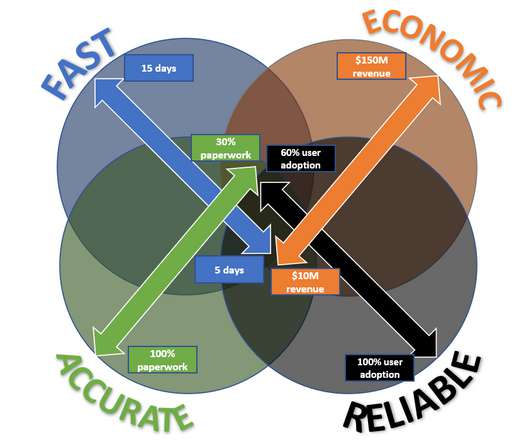
KPI-1 : Cycle time reduction. Let’s define the next set of KPIs. KPI 2 : # Insurance Carriers using the solution? —?Hypothesis: Hypothesis: 2 in year 1, 10 in year 2, 20 in year 3, 50 in year 4 KPI 3 : Annual Revenue? —?Hypothesis: The KPIs you create will require a double and sometimes a triple click.
OKRs vs KPIs – the most recent darlings of the SaaS world. Everyone wants to use them, but a lot of people tend to confuse what they are for and how to actually implement them properly. How do they compare to metrics ? All key performance indicators are metrics, but not all metrics are KPIs. What are KPIs?
A key result is not the same thing as a KPI (key performance indicator). A KPI is used to measure the continued progress towards a defined performance measure. Execution is how. Good product strategy boils down to making trade-off decisions about where and how to compete. This cannot be said enough: Outcome > Output.
In practice companies struggle with settling for just one top KPI, and with good reason. North Star Metric, One Metric, top business KPI?—?are Read on to learn how to put to use this powerful technique. these are the familiar Key Performance Indicators (KPIs): Revenue, Net Income, Paying Customers, Active users, etc.
With the right Growth KPI in place for active usage, you make a tangible impact on the business when you improve the number. Making that a Growth KPI would have shown a dip in your operation fairly early on, signaling a need for some changes. Step one is to define the Growth KPI in your analytics tool. How to get started.
Articles with life hacks on how to solve the “Sales vs. Marketing” problems are all over the web. That conflict is easily manageable /if only that was so easy/ with introducing KPI/OKR adjustments for those departments and improving cross-functional processes. Do you have line employees’ KPI aimed at the metric you are cutting down?
How To Operationalize Insights: 3 key pieces By operationalize, we mean make it a repeatable and reliable process so that you end up with a pipeline of insights to drive experiments and product improvements. There are common methods for doing this, both from statistics and machine learning.
OKRs are different from KPIs because a KPI is strictly a metric that reflects performance. A product marketing OKR is important because it establishes a solid foundation for the product marketing process , brings clarity on how you’ll achieve the company-wide goals, motivates your team, and brings controlled autonomy.
So how do you zero in on the most meaningful outcomes from which to center your roadmap themes around? How to Decide on Roadmap Themes that Produce Meaningful Outcomes. CUSTOMER KPI: Reach. BUSINESS KPI: Reach as a % of Total Addressable Market (TAM). CUSTOMER KPI: Time to deal close. Phase 2: Evaluate & buy.
A lot of teams struggle with how to increase engagement. We all want our product to be used more often and by more people, but how do we identify opportunities that will transform how your product is used? Many teams might immediately jump to finding solutions that will help move toward that KPI.
You can use OKRs to create a robust system of decision-making where every employee knows how to get things done and track their progress towards certain tasks. OKR vs KPI vs Metrics. Now you might be confused among Objectives and Key Results (OKRs), key performance indicators (KPIs), and metrics. How to grade OKRs.
Make UX A Part of the KPI Conversation With Universal Measures. Make UX A Part of the KPI Conversation With Universal Measures Key Performance Indicators or KPIs are basic measures that are often front in center in most board rooms. ON-DEMAND WEBINAR. About the webinar speaker.
For decades, user experience professionals have been debating how to associate experience measures with these key KPIs. When attempting to make these associations UX practitioners struggle to consistently associate research findings to concrete KPIs. How practitioners can make experience a critical KPI for their organization.
How different metrics affect MRR. Top metrics to measure customer growth To assess customer growth effectively, it’s important to consider a variety of key metrics, as no single KPI can tell the whole story. How to calculate CSAT. How to calculate customer growth rate? How to calculate the customer growth rate.
Note that depending on your product and its usage interval, you might have to change this) Retention: 3/7/14 Day Monetization: LTV; Daily revenue per user, units sold, discount rate, unit ASP How to setup your KPI dashboard(s): Once you have done all of the above setting up your dashboard is relatively simple.
As you read on, you will learn: How to properly define revenue growth. Related metrics that impact your revenue and how to use the insights to turn your product into a growth engine. It serves as a key performance indicator (KPI) for evaluating the effectiveness of various business strategies. How to calculate CAC.
Wondering how to build a customer success dashboard for your team? And how to build a dashboard for your customer success team using Userpilot analytics ! Here’s the process: Choose the metrics to track and decide how to collect the data. Here’s how to build a customer success dashboard. Let’s dive right in!
How to choose the date range for your analysis? How to conduct a period-over-period analysis with Userpilot : Select the metrics you need to analyze. How to conduct a period-over-period analysis with Userpilot Userpilot’s robust analytics features let you conduct PoP analysis and collect valuable data to inform strategic decisions.
In the end, we had great momentum on the deal size, but if we considered revenues as our KPI, we were at a standstill. We’ll talk about how to handle investors and your team through a pivot in the next article. The big issue was that in the context of very low budget, the extra data was just a nice-to-have for marketing teams.
We organize all of the trending information in your field so you don't have to. Join 96,000+ users and stay up to date on the latest articles your peers are reading.
You know about us, now we want to get to know you!
Let's personalize your content
Let's get even more personalized
We recognize your account from another site in our network, please click 'Send Email' below to continue with verifying your account and setting a password.


Let's personalize your content